How to Use AI to Explore an Unknown Dataset
Where AI genuinely speeds up the first hour with an unfamiliar dataset, and where it confidently gets things wrong
5 Minutes Read
Data Analytics Program — Data Analytics — Next cohort Starts Oct 24 · 35% Discount
Enroll NowWhere AI genuinely speeds up the first hour with an unfamiliar dataset, and where it confidently gets things wrong
Someone hands you a file. Forty-odd columns, names like status_cd and dt_1, no documentation, and a question that needs answering by Thursday. This is one of the situations where AI genuinely helps, and also one where it will confidently tell you something wrong in a tone indistinguishable from telling you something right.
The distinction that matters is narrow but decisive: AI is good at the mechanical half of exploration, generating the profiling code, suggesting checks you might not have thought of, translating what you find into a plan. It is not good at the interpretive half, knowing what your columns actually mean. Confusing the two is how an exploration session produces a fast, fluent, wrong understanding of the data.
The running example: shipments_export.csv, inherited from the operations team, roughly 40 columns, including status_cd, dt_1, dt_2, zone, wt_kg, and flag_r. Nobody has written any of it down.
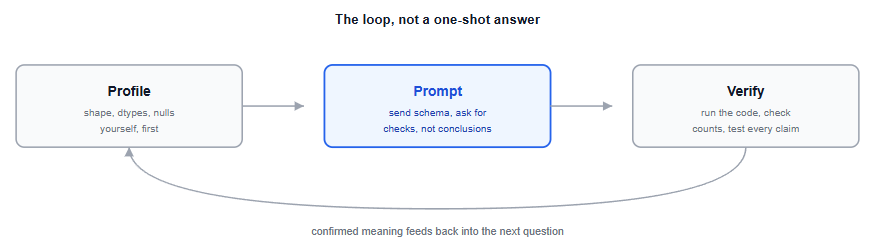
Run the basics first. This takes about a minute and it gives you facts, not guesses, to check every later AI suggestion against.
python
import pandas as pd

df = pd.read_csv("shipments_export.csv")

df.shape                      # how many rows and columns
df.info()                     # column names, dtypes, non-null counts
df.describe(include="all")    # ranges, uniques, most frequent values
df.isna().mean().sort_values(ascending=False)   # null rate per column
df.info() gives you the dtypes and non-null counts, and df.describe() gives ranges and frequencies for both numeric and text columns when you pass include="all". Together they answer the questions that don't require any judgment: how big is this, what type is each column, and how much of it is missing. If any of these commands feel unfamiliar, Pandas basics for data analysts covers DataFrames, filtering, and indexing with the SQL equivalent shown next to each one.
Doing this first matters for a reason beyond speed. Once you have the real dtypes and null rates in front of you, you can immediately catch an AI that assumes wt_kg is numeric when it actually loaded as text, or that treats a column as complete when 60% of it is null.
This guide assumes a CSV loaded into pandas, but the same profile-first instinct applies just as directly to a database table; your first 10 SQL queries covers the SQL side of exactly this kind of first look.
There are two reasons not to paste raw rows into a general-purpose AI tool.
The first is privacy. A shipments export may contain customer names, addresses, and phone numbers. Pasting real records into a tool your company hasn't approved for that data is a genuine problem, independent of how useful the answer is. Data handling terms vary by product and tier, even within the same vendor; OpenAI's own enterprise privacy documentation, for instance, spells out retention periods and training-use policies that differ across its consumer and business offerings. Check what your organisation actually permits before sending anything, and prefer summaries over records by default.
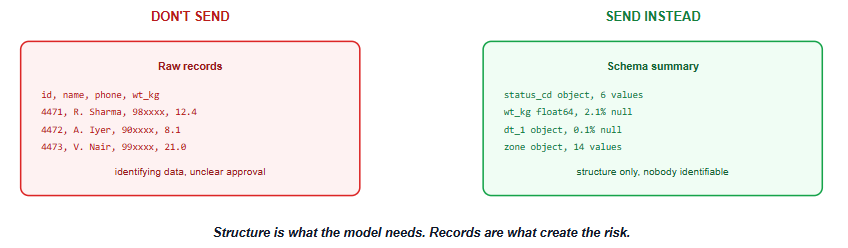
The second is that raw rows aren't what the model needs anyway. What helps is structure: column names, dtypes, null rates, a handful of distinct values per categorical column, and ranges for the numeric ones. That's enough for a useful conversation and it's the part that doesn't identify anyone.
A workable prompt looks closer to this than to a paste of the file:
Here is the schema of a logistics shipments export I've inherited.
40 columns. Row count 2.3M.

status_cd   object,  6 distinct values: D, R, P, X, C, H
dt_1        object,  0.1% null, format YYYY-MM-DD HH:MM
dt_2        object,  8.4% null, format YYYY-MM-DD HH:MM
zone        object,  14 distinct values
wt_kg       float64, min 0.01, max 4812, 2.1% null
flag_r      int64,   values 0 and 1

What should I check first, and what are the most likely
traps in a dataset shaped like this?The useful request is "what should I investigate," not "what does this data say." A model given the schema above will typically suggest reasonable things: verify whether dt_2 is always later than dt_1, check whether flag_r correlates with a particular status_cd, look at whether the wt_kg maximum of 4812 is a real freight shipment or a unit error.
Those are good suggestions. None of them are findings. Each one is a hypothesis you now have to test against the actual data, which is exactly the right division of labour: the model proposes, the dataset decides.
This is also where AI earns its keep on the unglamorous part. Asking for the pandas or SQL to run each check, rather than writing it yourself, is a genuine time saving, and a wrong query usually announces itself when you run it.
Here is where the shipments example gets specific. Ask a model what dt_1 and dt_2 are, and it will tell you, fluently, that dt_1 is likely the shipment creation date and dt_2 the delivery date. That is a sensible guess. It is also, in a real logistics export, roughly a coin flip. dt_2 might be the promised delivery date rather than the actual one, which changes the meaning of every on-time metric you're about to build.
The same applies to status_cd = 'R'. Returned? Rescheduled? Received? A model will pick the most common convention and present it without hedging. The operations team knows the answer in about ten seconds. No amount of prompting recovers information that isn't in the data.
The practical rule: anything about structure, AI can help with. Anything about meaning, confirm with a human who owns the source system, and write down what they tell you, because the next analyst will need it too.
Three habits keep confident wrong answers out of your work.
Run every piece of generated code rather than reading it. Generated pandas or SQL frequently looks right and references a column that doesn't exist, or applies a filter that silently drops most of the rows. Running it against the real data surfaces this in seconds.
Check counts before and after any operation. If a suggested cleaning step drops rows, know how many and why. A step that quietly removes 40% of the dataset is the kind of thing that only shows up much later, in a number nobody can reconcile.
Treat every AI-stated fact about the data as a claim to test. Not because the model is usually wrong, but because you can't tell from the output which case you're in. The tone is identical either way. NIST's AI Risk Management Framework names this specific failure mode directly, confabulation, as one of the risk categories its generative AI guidance addresses, which is a useful reminder that this isn't a quirk of one tool but a documented characteristic of how these systems behave.
Understanding what one row represents is the single highest-value thing to establish early, and it's covered in more depth in the guide to databases, data warehouses and data types for analysts, which is worth a read if terms like table grain or fact and dimension tables aren't yet familiar.
Accepting a column's meaning from an AI's guess. A plausible interpretation stated confidently is still a guess, and column semantics are organisational knowledge that isn't recoverable from names and values alone.
Pasting raw records into a general-purpose tool. Send schema and summary statistics instead, and check what your organisation actually permits before sending anything at all.
Reading generated code instead of running it. Code that looks correct can reference a column that doesn't exist or filter away most of the dataset without complaint. The same discipline applies when the cleaning happens in a spreadsheet rather than code; cleaning messy data in Excel covers the manual equivalent of checking a step's output before trusting it.
Skipping your own profiling because the AI can do it. Running info() and a null-rate check yourself takes a minute and gives you the ground truth to catch the model's assumptions against.
Treating suggested findings as findings. A model proposing that flag_r probably marks returns is proposing a hypothesis, not reporting a result.
Not writing down what you learn. Once someone confirms what status_cd = 'R' means, that answer belongs in a data dictionary, not just in your memory of one Slack thread.
This guide is deliberately narrow, one task, done carefully. For the wider question of which parts of analyst work AI is genuinely changing and which it isn't, how AI is changing the data analyst role covers that in the same register, and AI tools for data analysts gives a verdict-per-tool view of what's worth using for this kind of work.
Once a dataset is actually understood, the next step is usually deciding how to report on it. Choosing the right chart for the question and Power BI data modeling both pick up from roughly where this guide leaves off, once the columns and their meaning are no longer a mystery.
The fastest way to build this habit is to practise it on a dataset nobody has explained to you. Several of the beginner project ideas start from exactly that position.
Quiz
Question 1 of 15
FAQ
FREE COURSES
Build practical Snowflake skills from the foundations to advanced analytics. Learn how to load and validate data, write business-focused SQL, query JSON, build reusable reporting models, and manage query performance, costs, and access. Across nine modules, you will work with consistent retail datasets, clear explanations, worked examples, practice exercises, and interview questions. Explore joins, window functions, customer retention, data quality checks, views, MERGE, Time Travel, tasks, streams, and dynamic tables.
Learn to collect real-world data through web scraping and APIs, the two main ways data analysts get data that isn't already in a clean file. You'll go from HTTP and HTML basics to real skills: parsing pages, handling pagination and JavaScript-heavy sites, working with APIs, and automating full data pipelines. Everything builds around one consistent case study, so lessons connect instead of feeling scattered. The course closes with three portfolio projects, price intelligence, job market analysis, and real estate trends, each with a real dataset and a full worked solution ready to add to your portfolio.
An 11-module, project-based course for data analysts who need to work fluently with finance data. Covers financial statements, unit economics, forecasting, valuation, market risk, and fraud analytics, all built around one running case company with real code, data, and a full answer key in every module.