Financial Analytics for Data Analysts

An 11-module, project-based course for data analysts who need to work fluently with finance data. Covers financial statements, unit economics, forecasting, valuation, market risk, and fraud analytics, all built around one running case company with real code, data, and a full answer key in every module.

author

Rutvik Acharya

Principal Data Scientist

Atlassian

Loading modules...

What You'll Learn

Read and analyze financial statements, then build forecasts and value a business using DCF and comparable companies

Apply SQL and Python to real general ledger data: cleaning, reconciliation, and star-schema modeling

Build and evaluate credit risk, fraud detection, and anomaly detection models

Communicate financial analysis clearly through dashboards, variance narratives, and board-ready reports

Who Should Attend

Data analysts who work with, or want to work with, finance data

FP&A, business, or financial analysts looking to strengthen their SQL and Python skills

Data scientists moving into finance, fintech, or risk analytics roles

Anyone with basic SQL and pandas experience who wants a practical, project-based finance foundation

CERTIFICATION

Certificate of Completion
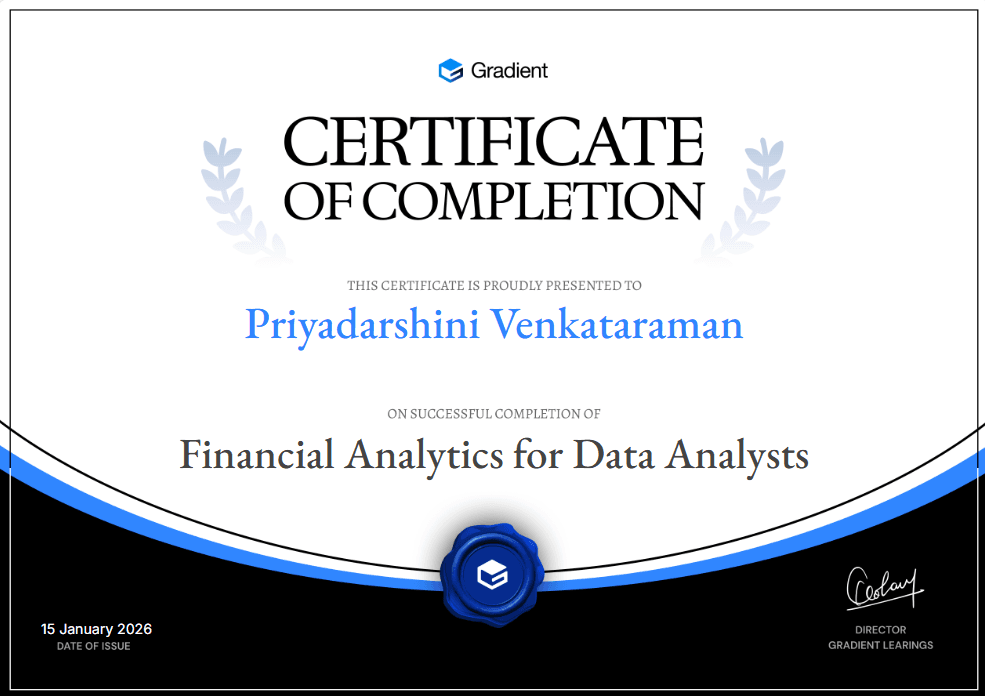
Certificate of Participation
Course
11 Modules
20 Hour
52 Lessons
52 Challenges
Language: English

FAQ

FREQUENTLY ASKED QUESTIONS

You should be comfortable with working SQL, including joins and aggregation, and have basic pandas experience. No finance background is assumed. The course starts from first principles on the finance side and builds up from there.
The course uses SQL and Python throughout, including pandas for data work, and a few financial and statistical libraries such as numpy_financial and scikit-learn in later modules. Excel is also covered in Module 2 alongside SQL and Python so you can see the same calculations built three ways.
The course is made up of 11 modules totaling around 20 hours of material. Each module builds on the last, so it is designed to be worked through in order rather than skipped around.
Yes, this is a free course.
Every module uses one running case company, Harbor & Pine Co., so the numbers stay consistent and build on each other as the techniques get more advanced. You work with its real financial statements, general ledger data, forecasts, and valuation models from Module 1 through Module 10.
No. Module 1 explicitly assumes no finance background and introduces the vocabulary, accounting logic, and conventions you need from the ground up before any analytical technique is introduced.
Each module is organized into lessons covering a specific technique, with worked examples, practice exercises, interview-style questions, and key takeaways. A full answer key is provided at the end of each module.
The course goes from financial statement fundamentals and the time value of money, through finance data preparation, statement analysis, cost behavior and unit economics, budgeting and forecasting, valuation and investment decisions, market returns and risk, and credit and fraud analytics, finishing with reporting and storytelling.
Module 10 covers reporting, dashboards, and storytelling, including how to structure a financial narrative, choose the right chart, and build a board-ready report. Module 11 consists of two capstone portfolio projects that apply everything from the earlier modules to a new company and dataset.
Yes. Each module lists the specific prior modules it assumes, and the later modules, including the capstone projects in Module 11, build directly on techniques and data established earlier in the course.
Scroll Up
GET FREE CAREER COUNSELING
Financial Analytics for Data Analysts | 11-Module Course