7 Types of Business Problems Data Analysts Solve
A practical framework for identifying what the business actually needs before you write a single query
5 Minutes Read
Data Analytics Program — Data Analytics — Next cohort Starts Oct 24 · 35% Discount
Enroll NowA practical framework for identifying what the business actually needs before you write a single query
Most analytical mistakes happen before anyone touches the data. A stakeholder asks a question, the analyst opens a SQL editor, and two hours later delivers something technically correct and completely useless because it answered the wrong version of the problem.
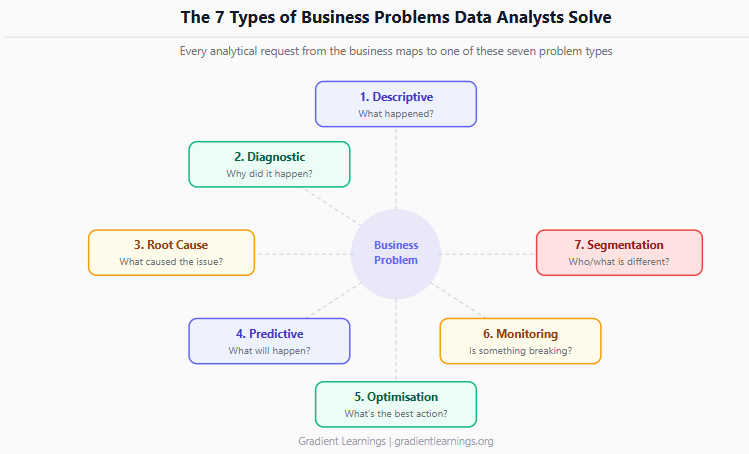
Most business requests a data analyst receives can be classified into one or more of seven common problem types. Knowing which type you are dealing with determines your approach, your deliverable, and the questions you need to ask before you start. This framework applies whether you are working in e-commerce, fintech, healthcare, SaaS, or any other domain.
The running example throughout this article is ShopSpark, a mid-sized e-commerce company. These seven problem types recur across many industries; the ShopSpark context just makes each one concrete.
Before mapping the seven types, it is worth understanding why this classification matters at all.
A stakeholder saying "can you look into our revenue?" is not a well-formed analytical problem. It could be asking you to describe what happened (Problem Type 1), explain why it changed (Type 2), trace an issue back to a root cause (Type 3), forecast what comes next (Type 4), optimise a decision (Type 5), build ongoing tracking (Type 6), or identify which customer groups behave differently (Type 7).
Each of those requires a different query structure, a different timeframe, and a different output format. Picking the wrong one wastes time and erodes trust with stakeholders.
The first thing an analyst should do when receiving a request is to classify the problem. Ask one clarifying question if needed: "Are you trying to understand what happened, why it happened, or what we should do about it?" The answer narrows the field to two or three types immediately.
If you want to understand why ambiguity leads to failed projects at a broader level, the Gradient Learnings article on why analytics projects fail covers the structural reasons in depth.
Descriptive problems ask: what happened?
These are the most common request type in most analytics teams. The business wants a summary of a metric, a comparison across time periods, or a breakdown by category. The output is a number, a table, or a chart that captures the current state of something.
At ShopSpark, a descriptive problem sounds like: "Show me total revenue for last month, broken down by product category." The stakeholder is not yet asking why or what to do. They want to know what is.
Descriptive analysis requires accurate aggregation, clean period definitions, and consistent dimensional breakdowns. It does not require causal reasoning or predictive modelling.
Typical SQL pattern for a descriptive problem:
sql
-- PostgreSQL syntax; adapt DATE_TRUNC syntax for your SQL engine
SELECT
    product_category,
    DATE_TRUNC('month', order_date) AS order_month,
    COUNT(DISTINCT order_id)        AS total_orders,
    SUM(revenue_usd)                AS total_revenue
FROM orders
WHERE order_date >= '2024-01-01'
  AND order_date <  '2024-04-01'
GROUP BY 1, 2
ORDER BY 2, 3 DESC;
The key mistake in descriptive work is adding uninvited interpretation. The stakeholder asked what happened. Delivering a summary table with an opinion section attached will confuse the communication and set the wrong expectations about what analysis was actually requested.
When descriptive is not enough: If the stakeholder reacts to your summary with "but why is electronics down?", you have just moved into Problem Type 2.
Diagnostic problems ask: why did it happen?
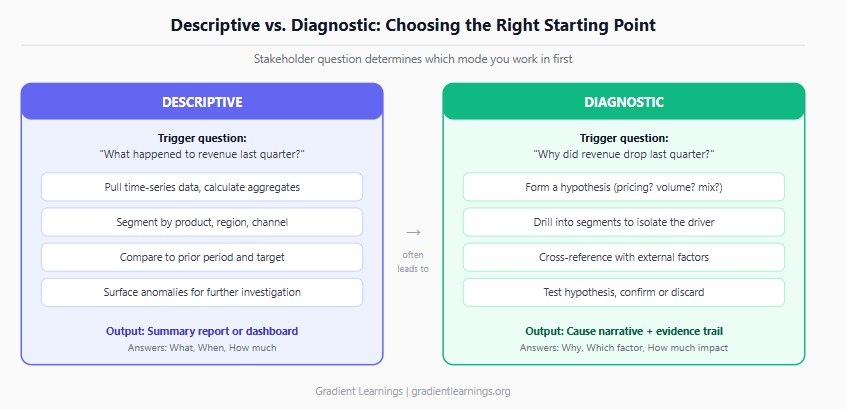
The stakeholder has already seen a descriptive output, or they already know a metric moved. They now want an explanation. Diagnostic work is investigative: you form hypotheses, test them against data, and eliminate alternatives until you identify the driver.
At ShopSpark: "Revenue from the mobile channel dropped 18% last month. Why?"
Diagnostic analysis requires segment-level drilling, comparative period analysis, and enough domain knowledge to generate plausible hypotheses. A good analyst enters a diagnostic problem with three to five candidate explanations, then uses data to disqualify them one by one.
A structured diagnostic approach for ShopSpark's mobile revenue question:
Confirm the scale: how much of total revenue does mobile represent? Is this a systemic issue or a rounding artefact?
Check if it is across all products or concentrated in a category.
Check if it is across all geographies or isolated.
Check if conversion rate changed, or if traffic changed, or both.
Look for timing: did the drop happen suddenly (suggesting a deploy or a pricing change) or gradually (suggesting a trend)?
sql
-- Diagnostic: break down the mobile channel drop by sub-dimension
-- PostgreSQL syntax
SELECT
    DATE_TRUNC('week', order_date)  AS week,
    product_category,
    geo_region,
    COUNT(DISTINCT session_id)      AS sessions,
    COUNT(DISTINCT order_id)        AS orders,
    ROUND(
        COUNT(DISTINCT order_id)::numeric /
        NULLIF(COUNT(DISTINCT session_id), 0), 4
    )                               AS conversion_rate,
    SUM(revenue_usd)                AS revenue
FROM orders
JOIN sessions USING (session_id)
WHERE channel = 'mobile'
  AND order_date >= '2024-01-01'
GROUP BY 1, 2, 3
ORDER BY 1, 7 DESC;
The PostgreSQL window functions documentation is useful when you need to compute running comparisons (e.g., week-over-week conversion deltas) within a diagnostic query.
The difference between descriptive and diagnostic is not just the question type: it is the epistemic goal. Descriptive work produces a snapshot. Diagnostic work produces a narrative with evidence attached. You are done with a diagnostic problem only when you can write one sentence that explains what drove the change and point to the data that supports it.
Root cause problems ask: what is the underlying cause of a persistent or recurring issue?
Root cause analysis is a more structured and rigorous form of diagnostic work. The difference is scope and stakes. Diagnostic problems are usually one-off: "why did revenue drop this month?" Root cause problems are systemic: "why does our checkout abandonment rate spike every Friday evening?" or "why do a disproportionate number of orders from a specific region arrive with the wrong item?"
Root cause analysis requires more than drilled-down queries. It requires a documented hypothesis framework, controlled comparisons, and explicit testing of alternative explanations. The goal is not just to find a plausible story; it is to build a well-supported explanation of the underlying mechanism and test alternative explanations rigorously enough to survive scrutiny from engineering, product, and operations teams. Observational SQL analysis can narrow the field substantially, but establishing true causality typically requires experiments or dedicated causal inference methods (see FAQ 14 on A/B testing).
ShopSpark example: Orders from a specific carrier show a return rate three times higher than other carriers. The diagnostic question is "why is this carrier's return rate high?" The root cause question is: "what is the causal mechanism, and does it lie with the carrier, with the product categories they primarily ship, or with the geography they serve?"
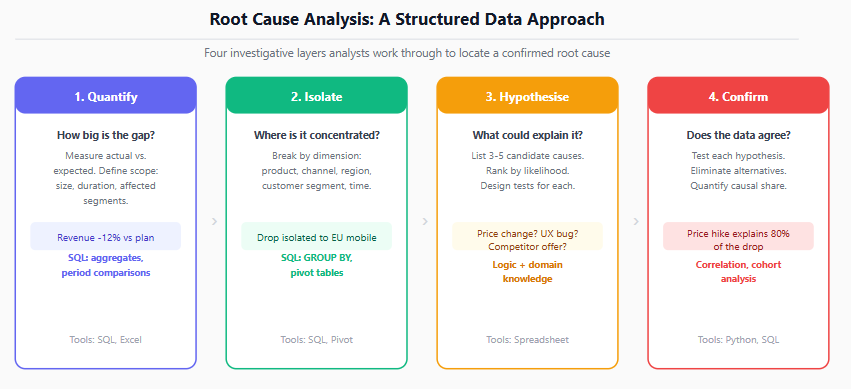
The four stages of a data-driven root cause investigation:
Stage 1: Quantify. Confirm the scale and scope of the problem with precise numbers. Vague problem statements lead to vague conclusions.
Stage 2: Isolate. Slice the problem by every available dimension (product, geography, time, customer type, carrier, warehouse) to identify where the issue is concentrated. The isolation step often provides the first strong clue.
Stage 3: Hypothesise. List candidate causes ranked by likelihood. For the ShopSpark carrier example: (a) the carrier handles fragile product categories disproportionately, (b) that carrier's shipping time is longer, increasing buyer regret, (c) a packaging issue at a specific warehouse affects this carrier's route.
Stage 4: Confirm. Test each hypothesis with data. Control for observed confounding variables where possible. Estimate how strongly each factor is associated with the outcome, and eliminate alternatives that the data does not support.
Root cause analysis is where strong SQL skills become essential: you need subqueries, cohort comparisons, and conditional aggregation to test competing explanations within a single dataset.
Predictive problems ask: what is likely to happen?
Predictive work shifts the analytical orientation from the past to the future. The business is not trying to understand what happened. It wants a forward-looking estimate to support a decision it has not yet made.
At ShopSpark: "Which customers are most likely to churn in the next 30 days?" or "What will our inventory demand look like for the holiday season?"
Predictive problems typically require historical data, a defined prediction target, relevant features, and either a statistical or model-based approach or a simpler rule-based method. The analyst's primary deliverable is not a model itself: it is a scored output the business can act on.
A Simple Rule-Based Risk Signal:
This is not a trained predictive model. It is a heuristic that uses behavioural signals to flag customers who may be at higher risk. A production churn model would require a labelled historical outcome, feature engineering, model training, and out-of-sample evaluation. The query below demonstrates the signal construction step only.
sql
-- Identify at-risk customers using behavioural signals
-- Works in PostgreSQL and BigQuery; adapt date functions for other engines
WITH customer_activity AS (
    SELECT
        customer_id,
        MAX(order_date)                             AS last_order_date,
        COUNT(DISTINCT order_id)                    AS total_orders,
        AVG(revenue_usd)                            AS avg_order_value,
        CURRENT_DATE - MAX(order_date)::date        AS days_since_last_order
    FROM orders
    GROUP BY 1
),
risk_flags AS (
    SELECT
        customer_id,
        days_since_last_order,
        total_orders,
        avg_order_value,
        CASE
            WHEN days_since_last_order > 90  THEN 'high_risk'
            WHEN days_since_last_order > 45  THEN 'medium_risk'
            ELSE 'low_risk'
        END AS churn_risk_segment
    FROM customer_activity
)
SELECT * FROM risk_flags
ORDER BY days_since_last_order DESC;
For more sophisticated predictive modelling, scikit-learn provides a comprehensive set of classification and regression algorithms, along with cross-validation utilities for evaluating model performance.
The most important discipline in predictive work is communicating uncertainty. A forecast is a probability distribution, not a single number. When presenting predictive outputs, always show the confidence range or the conditions under which the forecast degrades.
For analysts who work in Python, Pandas and its time-series functionality are a natural starting point for building forecasting datasets before handing them to a modelling library. The Gradient Learnings guide to pandas basics for data analysts covers the foundational techniques.
These three problem types are forward-looking or structural, and they are commonly conflated with each other or with predictive work. The comparison below clarifies the distinctions.
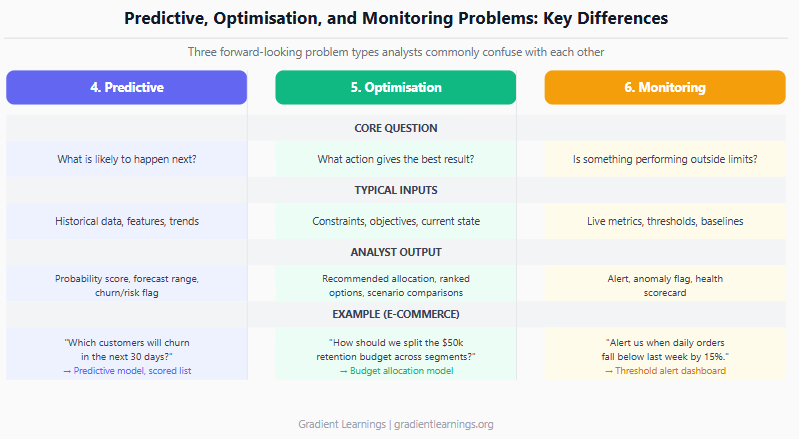
Optimisation problems ask: what is the best action given a set of constraints?
The distinguishing feature of an optimisation problem is that the business has already accepted a set of constraints (budget, capacity, time, risk tolerance) and wants to know how to distribute effort or resources to maximise an objective.
At ShopSpark: "We have $50,000 for retention campaigns this month. How should we allocate it across our four customer segments to maximise recovered revenue?"
Optimisation problems often arrive dressed as predictive questions, but they are distinct. Predictive work tells you what will happen. Optimisation work tells you what to do. A predictive model might tell you which customers are most likely to churn. The optimisation layer tells you which of those customers to target given your budget and expected recovery rate.
Simple optimisation work can be done with scenario modelling in Python or Excel. More complex constraint satisfaction may require linear programming (available via Python's scipy.optimize module). For most analyst-level optimisation, building a ranked comparison table with explicit assumptions visible to stakeholders is more useful than a black-box solver.
Monitoring problems ask: is something performing outside its expected range?
Monitoring is structural, ongoing work. It is not a one-time investigation. The business wants a systematic mechanism to surface problems before they become visible in a quarterly report.
At ShopSpark: "Alert us if daily order volume falls below the 14-day moving average by more than 15%."
Monitoring problems require threshold definition, a cadence for checking, a notification mechanism, and a process for deciding when to escalate versus investigate. The analyst's job is to build the detection logic, set defensible thresholds, and document what action the alert should trigger.
A key discipline in monitoring work is avoiding alert fatigue. A threshold that triggers on normal variance will be ignored within a week. Thresholds should be calibrated against historical noise levels, not set arbitrarily.
sql
-- Monitoring: compute a rolling average and flag deviations
-- Standard SQL window function syntax; compatible with PostgreSQL, BigQuery, Snowflake, Redshift
WITH daily_orders AS (
    SELECT
        order_date,
        COUNT(DISTINCT order_id) AS orders_today
    FROM orders
    GROUP BY 1
),
rolling_avg AS (
    SELECT
        order_date,
        orders_today,
        AVG(orders_today) OVER (
            ORDER BY order_date
            ROWS BETWEEN 13 PRECEDING AND 1 PRECEDING
        ) AS avg_14d
    FROM daily_orders
)
SELECT
    order_date,
    orders_today,
    ROUND(avg_14d, 1)           AS rolling_avg_14d,
    ROUND(
        (orders_today - avg_14d) / NULLIF(avg_14d, 0) * 100, 1
    )                           AS pct_deviation,
    CASE
        WHEN orders_today < avg_14d * 0.85 THEN 'ALERT'
        ELSE 'OK'
    END                         AS status
FROM rolling_avg
ORDER BY order_date DESC;Segmentation problems ask: which groups within our data behave meaningfully differently from each other?
Segmentation is both a standalone problem type and a supporting technique used in diagnostic and predictive work. As a standalone problem, the business wants to understand structural differences across its customer base, product catalogue, or operational units.
At ShopSpark: "Who are our top customer segments? How do their purchase frequency, average order value, and category preferences differ?"
Good segmentation produces groups that are meaningfully different from each other (high inter-group variance) and internally coherent (low intra-group variance). The most common analyst-level segmentation techniques are rule-based cohort definitions (RFM: recency, frequency, monetary value), SQL-based groupings, or clustering algorithms when the structure is not known in advance.
The risk in segmentation is over-segmenting. Fifteen micro-segments that each represent less than one percent of revenue are not actionable. Good segmentation produces groups the business can actually build strategies around.
sql
-- RFM segmentation: score customers by recency, frequency, value
-- Adapt CURRENT_DATE function for your SQL engine
SELECT
    customer_id,
    CURRENT_DATE - MAX(order_date)::date    AS recency_days,
    COUNT(DISTINCT order_id)                AS frequency,
    SUM(revenue_usd)                        AS monetary_value,
    NTILE(4) OVER (ORDER BY MAX(order_date) DESC)   AS r_score,
    NTILE(4) OVER (ORDER BY COUNT(DISTINCT order_id))  AS f_score,
    NTILE(4) OVER (ORDER BY SUM(revenue_usd))          AS m_score
FROM orders
GROUP BY 1;
Understanding Python gives you access to more sophisticated clustering approaches. The Gradient Learnings guide to Python skills for data analysts covers the libraries and approaches relevant to segmentation work.
Most errors in analytical work are not technical. They are framing errors: delivering a diagnostic analysis when the stakeholder needed descriptive, or building a monitoring dashboard when the actual problem was root cause.
The checklist below maps each problem type to its correct output, common trigger language, and the most frequent mistake analysts make.
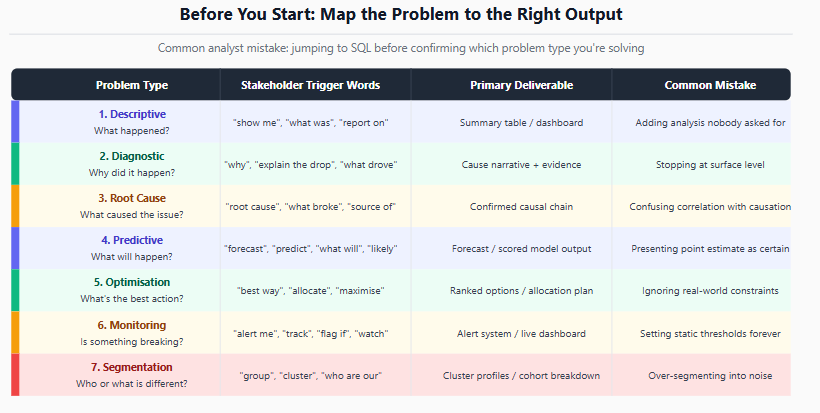
The three most common mistakes across all problem types:
Mistake 1: Jumping to SQL before classifying the problem. The first step is always to identify the problem type. Write it down. If you cannot label it, you have not understood the request.
Mistake 2: Treating diagnostic and root cause as the same thing. Diagnostic work answers "why did this specific metric move this period?" Root cause work answers "what is the systemic mechanism that produces this pattern repeatedly?" The former is a point-in-time investigation; the latter is a structural finding.
Mistake 3: Presenting a prediction as a fact. Forecasts carry uncertainty. Present them with a range, note the key assumptions, and flag the conditions that would invalidate the forecast. Stakeholders who are not told about uncertainty will treat a forecast as a commitment.
If you find that your team routinely works through all seven problem types but struggles to present findings clearly, the Gradient Learnings guide on presenting bad news from analysis to senior leaders addresses how to communicate difficult findings at every stage.
Mapping a business question to the right problem type is the first analytical skill. Building fluency in the techniques required for each type is the ongoing work of a practising analyst.
Descriptive and diagnostic work rely heavily on SQL. The SQL for data analysts guide covers the query patterns you need for aggregation, window functions, and period comparisons.
Segmentation and predictive work benefit from Python. The Gradient Learnings pandas basics article is the right starting point for building datasets and cohort tables.
Funnel analysis is a specialised form of diagnostic and segmentation work that deserves its own treatment. The funnel analysis guide covers how to identify where customers exit a conversion flow.
For an understanding of how AI tools are beginning to automate parts of descriptive and diagnostic work, the Gradient Learnings overview of AI tools for data analysts is a practical reference.
Quiz
Question 1 of 15
FAQ
FREE COURSES
An 11-module SQL course for data analysts preparing for interviews, built around one consistent company (Kestrel Outfitters) and one repeated method: the Five Questions What is the grain? What rows do I need? How should I combine them? How should I calculate the answer? How do I validate it? Starts with how to approach an unfamiliar SQL problem, then builds through core retrieval, aggregation, joins, subqueries and CTEs, window functions, NULL and conditional logic, reshaping and combining data, working with time, and data quality and validation finishing with a dedicated module on performance for analysts. Every lesson includes a custom diagram and a set of interview questions tagged by difficulty (Screener, Analyst, Advanced, Case) and type (Conceptual, Query Writing, Debugging, Optimization, Business Case), each with a fully worked solution. PostgreSQL-first, with dialect callouts for MySQL, SQL Server, BigQuery, and Snowflake throughout.
A hands-on path from Python fundamentals to production-grade automation, built for data analysts. Learn to clean messy files, pull data from databases and APIs, generate automated Excel/PDF/PowerPoint reports, and schedule it all to run unattended - then go further with logging, secrets management, and workflow orchestration. Built around one consistent scenario: automating a retail company's weekly sales reporting. Closes with two full portfolio projects using real data and complete worked solutions. No prior programming experience required.
EDA sits between cleaned data and formal statistical testing, and this course treats it as its own real skill rather than a warm-up step. Five modules cover the EDA mindset, fast univariate and bivariate scanning, multivariate and time-based exploration, anomaly spotting, and turning an exploration session into a prioritized findings summary. Built on a full year of realistic daily business data, including genuine seasonality and two deliberately planted data quality anomalies that a later lesson finds and resolves. Closes with a cold first-look investigation on an unfamiliar dataset and a full performance deep-dive project.