Python Automation for Data Analysts

A hands-on path from Python fundamentals to production-grade automation, built for data analysts. Learn to clean messy files, pull data from databases and APIs, generate automated Excel/PDF/PowerPoint reports, and schedule it all to run unattended - then go further with logging, secrets management, and workflow orchestration. Built around one consistent scenario: automating a retail company's weekly sales reporting. Closes with two full portfolio projects using real data and complete worked solutions. No prior programming experience required.

author

Rutvik Acharya

Principal Data Scientist

Atlassian

Loading modules...

What You'll Learn

Automate file, Excel, and folder workflows using Python and pandas

Pull data automatically from databases, REST APIs, and web pages

Generate automated charts, PDF reports, PowerPoint decks, and emailed deliverables

Build resilient, production-style pipelines with logging, secrets management, and workflow orchestration

Who Should Attend

Data analysts who want to stop doing repetitive reporting work by hand

Excel-proficient analysts ready to learn Python for real-world automation

Anyone who regularly pulls, cleans, and reports on data from multiple sources

Analysts looking to build a portfolio that demonstrates practical automation skills

CERTIFICATION

Certificate of Completion
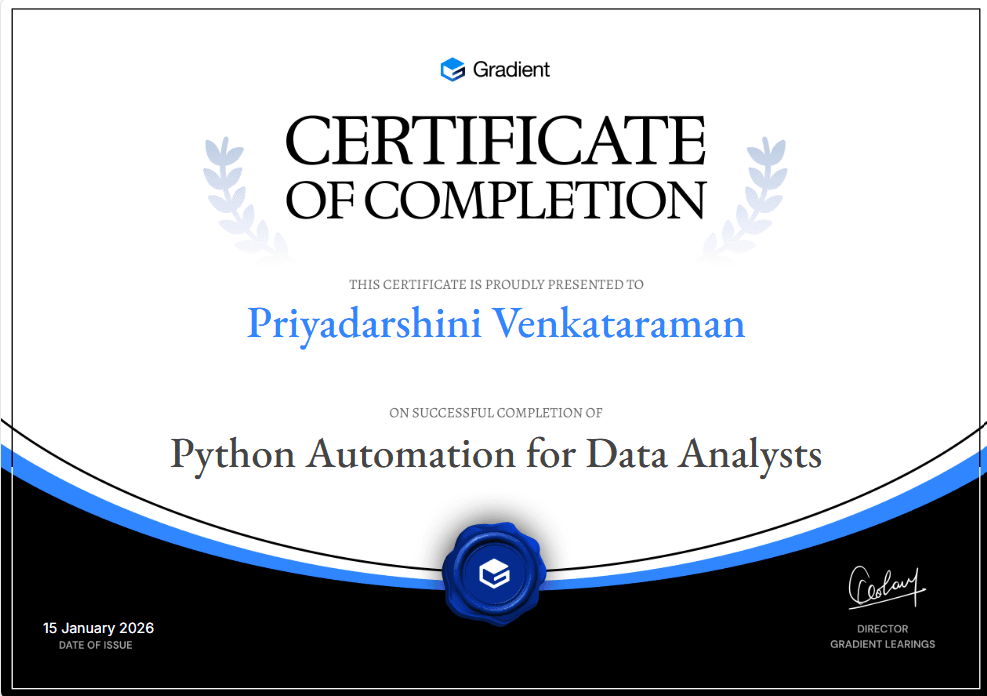
Certificate of Participation
Course
7 Modules
10 Hours 45 Minutes
40 Lessons
40 Challenges
Language: English

FAQ

FREQUENTLY ASKED QUESTIONS

No. Module 1 starts from Python fundamentals, including variables, control flow, functions, and data structures, before any automation work begins. The course is built for data analysts who are comfortable with spreadsheets and basic SQL but have not necessarily written Python before.
You will be able to automate the kind of work analysts typically do by hand: cleaning and combining multiple data files, pulling data from databases and APIs, generating formatted Excel and PDF reports, and scheduling scripts to run on their own. The course closes with two full portfolio projects, an automated weekly sales reporting pipeline and a competitor pricing monitor, both built on real data with complete worked solutions.
The course has 7 modules and 40 lessons. It moves from Python foundations, through file and Excel automation, data retrieval from databases and APIs, automated reporting and visualization, production-grade practices like logging and secrets management, and workflow orchestration with Prefect, ending in two complete portfolio projects.
Yes. Every module builds around one running scenario: automating the weekly sales reporting process for a mid-size retail company. Each module adds a new capability to that same scenario, so the skills accumulate into one coherent, realistic project rather than a series of disconnected exercises.
The course totals roughly 10 hours and 45 minutes of content across 7 modules and 40 lessons, though the exact pace will depend on how much time you spend on the practice exercises and the two portfolio projects.
You will work with pandas, openpyxl, matplotlib, reportlab, python-pptx, requests, BeautifulSoup, sqlite3, and Prefect, alongside core practices like Git, environment variables for secrets, argparse, and Task Scheduler or cron for scheduling.
The first is an automated weekly sales reporting pipeline that extracts, cleans, and analyzes multi-region sales data and produces an Excel workbook, a PDF report, and a chart. The second is a market and competitor data monitor that scrapes competitor pricing, compares it against a product catalog, and flags products where the competitor undercuts on price. Both projects include real sample data, a complete worked solution, and verified results.
Module 1 walks through the full setup, including installing Python, setting up VS Code, and creating a virtual environment for the course project. No setup is required beforehand.
Yes. Module 2 covers scheduling scripts with Task Scheduler and cron, and Module 6 goes further with workflow orchestration using Prefect, including task dependencies, automatic retries, and alerting when a scheduled pipeline fails.
No. The course uses a retail sales reporting scenario to keep every lesson concrete and consistent, but the underlying skills, cleaning and combining data, pulling from databases and APIs, generating reports, and building resilient scheduled pipelines, apply to data analyst work in any industry.
Scroll Up
GET FREE CAREER COUNSELING
Python Automation for Data Analysts Course | Gradient Learnings