Funnel Analysis: Finding Where Your Customers Actually Drop Off
A practical guide to building, reading, and acting on funnel analysis: from defining steps correctly to segmenting drop-off and avoiding the most common mistakes
5 Minutes Read
Data Analytics Program — Data Analytics — Next cohort Starts Oct 24 · 35% Discount
Enroll NowA practical guide to building, reading, and acting on funnel analysis: from defining steps correctly to segmenting drop-off and avoiding the most common mistakes
Most products have a conversion problem somewhere. A user lands on a signup page and doesn't complete the form. A customer adds items to a cart and doesn't check out. A trial user activates but never reaches the moment that makes the product sticky. The product works. The journey to using it leaks.
Funnel analysis is how you find exactly where the leak is. Not "conversion is down" as a general observation, but "62% of users who start the checkout flow abandon between the address entry step and the payment step, and that drop is three times higher on mobile than on desktop." That level of specificity is what turns an observation into something a product or growth team can actually act on.
This guide covers how funnel analysis actually works for an analyst: how to define the steps correctly, how to build it in SQL, what the output tells you and what it doesn't, how to segment it to find the real signal, and the most common mistakes that produce misleading funnels. The running example throughout is an e-commerce checkout flow, which applies the same logic that works across onboarding, subscription, and product activation funnels.
A funnel measures the sequential progression of a defined population through a defined set of steps, and the rate of drop-off at each transition.
Three words in that definition carry more weight than they appear to:
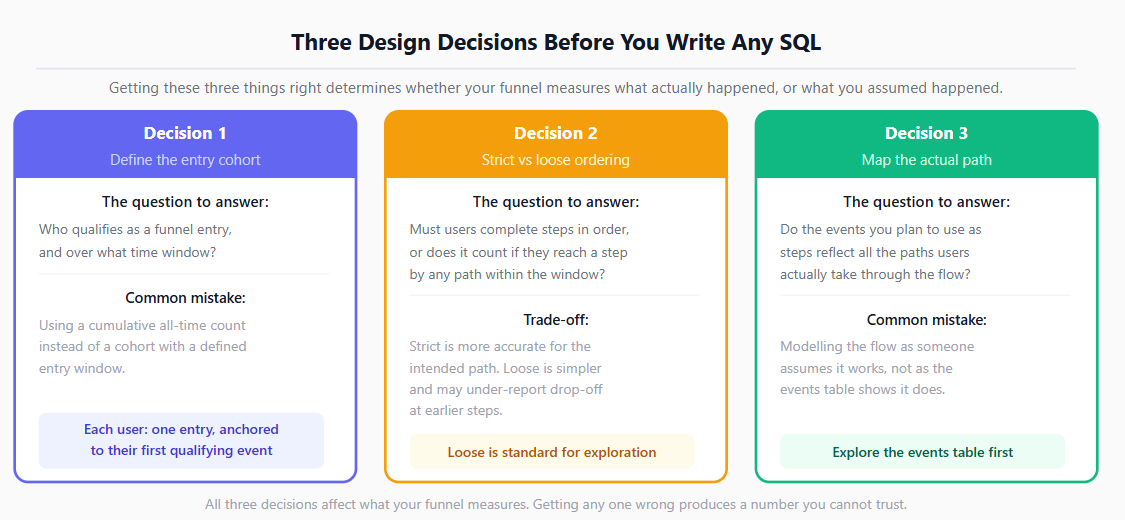
Sequential. A funnel is not a count of how many people ever completed each step. It is a count of how many people completed each step in order, after completing the one before it. A user who completed step 3 without completing step 2 is not counted in a strict funnel. Whether to enforce strict ordering is one of the first design decisions you will make and one of the most consequential for what the numbers mean.
Defined population. Every funnel starts with a cohort: users who performed a specific entry action in a specific time window. A funnel that mixes users who entered the flow last week with users who entered six months ago produces a number that is impossible to interpret cleanly, because the product, the pricing, and the user base may have all changed in between.
Defined set of steps. The steps must represent the actual journey, not the journey as someone assumes it works. If users can reach step 4 via two different paths, and only one of those paths is modelled in your funnel, the drop-off you see at step 3 includes people who took the second path rather than people who genuinely abandoned.
Getting these three things right before writing a single line of SQL is what separates a funnel that produces a real finding from one that produces a number that cannot be trusted.
Throughout this article, we will build a funnel for an e-commerce checkout flow with five steps:
View cart: user opens the cart page with at least one item
Start checkout: user clicks "Proceed to checkout"
Enter address: user submits a delivery address
Enter payment: user submits payment details
Order confirmed: order is placed successfully
The business question is: where in this five-step flow are we losing the most customers, and is the pattern different across device type?
The data lives in an events table with one row per user action:
sql
-- events table structure
event_id       BIGINT
user_id        VARCHAR
event_name     VARCHAR   -- e.g. 'cart_viewed', 'checkout_started'
event_ts       TIMESTAMP
device_type    VARCHAR   -- 'desktop', 'mobile', 'tablet'
session_id     VARCHAR
This is a standard event-level schema. The same SQL patterns apply whether you are working in BigQuery, Snowflake, Redshift, or PostgreSQL, with minor syntax differences in window functions.
The first query is not the funnel itself. It is the cohort: the set of users who performed the entry action (viewing the cart) within the analysis window.
sql
-- Step 1: Define the entry cohort
-- Users who viewed the cart between 1 Aug and 31 Aug 2026

WITH cohort AS (
  SELECT DISTINCT
    user_id,
    MIN(event_ts) AS first_cart_view_ts
  FROM events
  WHERE event_name = 'cart_viewed'
    AND event_ts >= '2026-08-01'
    AND event_ts <  '2026-09-01'
  GROUP BY user_id
)

SELECT COUNT(*) AS cohort_size FROM cohort;
-- Result: 48,320 users entered the funnel in August
Two decisions embedded in this query are worth naming explicitly.
First, MIN(event_ts) captures the user's first cart view in the window, not all of them. A user who viewed the cart five times in August is one cohort entry, not five. Counting all views would inflate the funnel denominator and understate conversion rates.
Second, the time window is a calendar month. This is a common choice, but the right window depends on what you are measuring. For a checkout funnel where most users complete or abandon within a session, a day-level window may be more appropriate. For an onboarding funnel where users may take a week to activate, a longer window is needed to avoid classifying in-progress users as abandoned.
With the cohort defined, the next step is counting how many cohort users reached each step. The standard approach uses conditional aggregation with MAX(CASE WHEN ...) per user, which assigns a 1 to each user for each step they reached.
sql
WITH cohort AS (
  SELECT
    user_id,
    MIN(event_ts) AS entry_ts
  FROM events
  WHERE event_name = 'cart_viewed'
    AND event_ts >= '2026-08-01'
    AND event_ts <  '2026-09-01'
  GROUP BY user_id
),

user_steps AS (
  SELECT
    c.user_id,
    c.entry_ts,
    MAX(CASE WHEN e.event_name = 'cart_viewed'       THEN 1 ELSE 0 END) AS step_1,
    MAX(CASE WHEN e.event_name = 'checkout_started'  THEN 1 ELSE 0 END) AS step_2,
    MAX(CASE WHEN e.event_name = 'address_submitted' THEN 1 ELSE 0 END) AS step_3,
    MAX(CASE WHEN e.event_name = 'payment_submitted' THEN 1 ELSE 0 END) AS step_4,
    MAX(CASE WHEN e.event_name = 'order_confirmed'   THEN 1 ELSE 0 END) AS step_5
  FROM cohort c
  LEFT JOIN events e
    ON c.user_id = e.user_id
   AND e.event_ts >= c.entry_ts
   AND e.event_ts <  c.entry_ts + INTERVAL '24 hours'
  GROUP BY c.user_id, c.entry_ts
)

SELECT
  SUM(step_1) AS cart_viewed,
  SUM(step_2) AS checkout_started,
  SUM(step_3) AS address_submitted,
  SUM(step_4) AS payment_submitted,
  SUM(step_5) AS order_confirmed
FROM user_steps;
The LEFT JOIN with a 24-hour window is a deliberate choice. It ties each user's subsequent events back to their cohort entry point and limits the lookahead window to 24 hours. This prevents events from a completely separate session weeks later from being credited to this funnel entry. The right window length depends on your product: shorter for high-intent flows like checkout, longer for activation flows where users may return over days.
This query produces loose funnel counts: a user is counted at step 4 if they performed the payment step event at any point within the window, regardless of whether they formally completed steps 2 and 3 in sequence. For a strict funnel, where each step requires all prior steps to have been completed in order, you would use window functions to enforce the sequence. Strict funnels give a more precise picture of the defined sequential journey, but require more careful SQL and can under-count users who take legitimate alternative paths. The loose approach is standard for exploratory analysis and is often sufficient for identifying where the largest drops occur.
The raw counts from Step 2 become meaningful once expressed as rates. Two rates matter: conversion from the top of the funnel (how many of the original cohort reached this step), and step-to-step conversion (how many users who reached the previous step made it to this one).
sql
-- Adding conversion rates to the funnel output

WITH funnel_counts AS (
  -- [previous query result as a subquery or CTE]
  SELECT
    48320 AS cart_viewed,
    31640 AS checkout_started,
    24180 AS address_submitted,
    19440 AS payment_submitted,
    15290 AS order_confirmed
)

SELECT
  'View cart'       AS step, cart_viewed       AS users,
    ROUND(100.0 * cart_viewed       / cart_viewed,       1) AS pct_of_top,
    NULL                                                     AS step_conversion
FROM funnel_counts
UNION ALL
SELECT 'Start checkout', checkout_started,
    ROUND(100.0 * checkout_started  / cart_viewed,       1),
    ROUND(100.0 * checkout_started  / cart_viewed,       1)
FROM funnel_counts
UNION ALL
SELECT 'Enter address',  address_submitted,
    ROUND(100.0 * address_submitted / cart_viewed,       1),
    ROUND(100.0 * address_submitted / checkout_started,  1)
FROM funnel_counts
UNION ALL
SELECT 'Enter payment',  payment_submitted,
    ROUND(100.0 * payment_submitted / cart_viewed,       1),
    ROUND(100.0 * payment_submitted / address_submitted, 1)
FROM funnel_counts
UNION ALL
SELECT 'Order confirmed', order_confirmed,
    ROUND(100.0 * order_confirmed   / cart_viewed,       1),
    ROUND(100.0 * order_confirmed   / payment_submitted, 1)
FROM funnel_counts;
The output of this query for the example data:
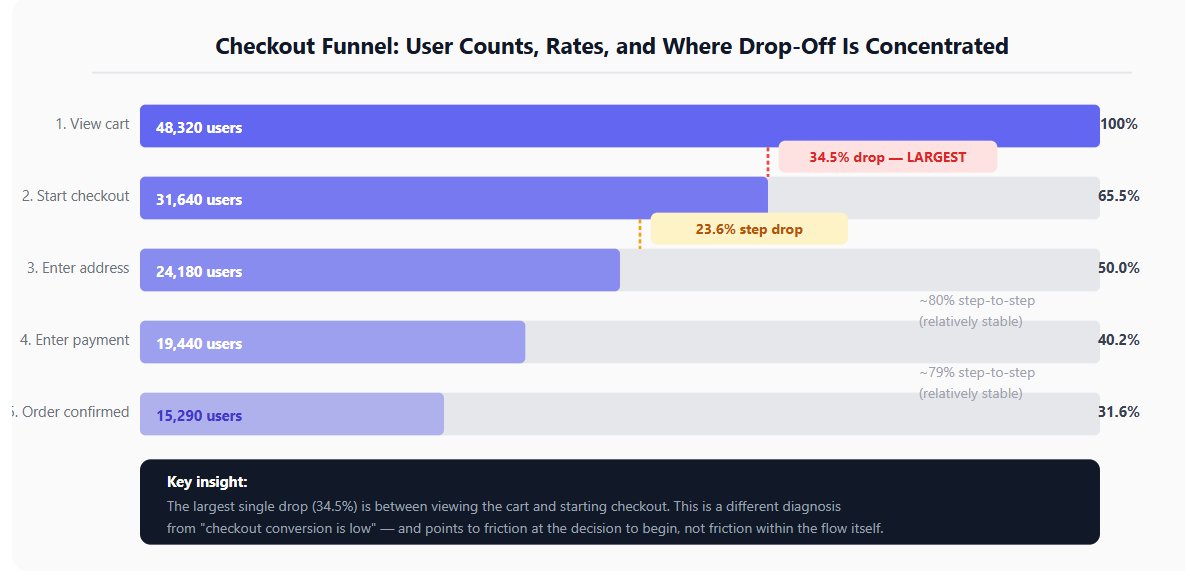
Step | Users | % of top | Step conversion |
|---|---|---|---|
View cart | 48,320 | 100% | N/A |
Start checkout | 31,640 | 65.5% | 65.5% |
Enter address | 24,180 | 50.0% | 76.4% |
Enter payment | 19,440 | 40.2% | 80.4% |
Order confirmed | 15,290 | 31.6% | 78.6% |
Reading this table, two things stand out immediately. The biggest single-step drop is between view cart and start checkout: 34.5% of users who viewed the cart did not begin the checkout process at all. The second-largest drop is between start checkout and enter address. Everything from address entry onward converts at roughly 78-80%, which is relatively stable. This suggests that the friction is concentrated at the decision to begin checkout, not in the checkout process itself.
That is a meaningfully different diagnosis from "checkout conversion is low," and it points to a different set of interventions.
A single overall funnel rate is a starting point, not a finding. The insight almost always lives in how the funnel breaks down across segments. The most common and useful segmentations for a checkout funnel are device type, acquisition channel, user type (new vs returning), and time of day or day of week.
Adding device type segmentation to the funnel query:
sql
-- Funnel segmented by device type
-- Uses ROW_NUMBER() to pick the device type from each user's
-- first cart-view event. This pattern works in BigQuery,
-- Snowflake, Redshift, and PostgreSQL. The window-function pattern
-- is portable across all four warehouses, although interval syntax
-- may vary slightly by warehouse (e.g. BigQuery uses INTERVAL 24 HOUR).

WITH first_events AS (
  SELECT
    user_id,
    event_ts,
    device_type,
    ROW_NUMBER() OVER (
      PARTITION BY user_id
      ORDER BY event_ts
    ) AS rn
  FROM events
  WHERE event_name = 'cart_viewed'
    AND event_ts >= '2026-08-01'
    AND event_ts <  '2026-09-01'
),

cohort AS (
  SELECT
    user_id,
    event_ts  AS entry_ts,
    device_type
  FROM first_events
  WHERE rn = 1
),

user_steps AS (
  SELECT
    c.user_id,
    c.device_type,
    MAX(CASE WHEN e.event_name = 'cart_viewed'       THEN 1 ELSE 0 END) AS step_1,
    MAX(CASE WHEN e.event_name = 'checkout_started'  THEN 1 ELSE 0 END) AS step_2,
    MAX(CASE WHEN e.event_name = 'address_submitted' THEN 1 ELSE 0 END) AS step_3,
    MAX(CASE WHEN e.event_name = 'payment_submitted' THEN 1 ELSE 0 END) AS step_4,
    MAX(CASE WHEN e.event_name = 'order_confirmed'   THEN 1 ELSE 0 END) AS step_5
  FROM cohort c
  LEFT JOIN events e
    ON c.user_id = e.user_id
   AND e.event_ts >= c.entry_ts
   AND e.event_ts <  c.entry_ts + INTERVAL '24 hours'
  GROUP BY c.user_id, c.device_type
)

SELECT
  device_type,
  SUM(step_1)                                           AS cart_viewed,
  SUM(step_2)                                           AS checkout_started,
  ROUND(100.0 * SUM(step_2) / NULLIF(SUM(step_1), 0), 1) AS cart_to_checkout_pct,
  SUM(step_5)                                           AS order_confirmed,
  ROUND(100.0 * SUM(step_5) / NULLIF(SUM(step_1), 0), 1) AS overall_conversion_pct
FROM user_steps
GROUP BY device_type
ORDER BY cart_viewed DESC;
Hypothetical output:
Device | Cart views | Checkout started | Cart to checkout | Order confirmed | Overall conversion |
|---|---|---|---|---|---|
Desktop | 21,480 | 15,620 | 72.7% | 8,940 | 41.6% |
Mobile | 22,340 | 13,180 | 59.0% | 5,640 | 25.2% |
Tablet | 4,500 | 2,840 | 63.1% | 710 | 15.8% |
This is the finding. Mobile accounts for the largest share of cart views but converts at 25.2% overall compared to 41.6% on desktop. The gap is largest at the cart-to-checkout step (59% on mobile vs 72.7% on desktop), which points to the first-step friction being meaningfully worse on mobile specifically. Tablet has the lowest overall conversion rate but also the smallest volume, so the priority ordering depends on what intervention is feasible.
This segmentation turns a funnel observation into a diagnosis. Without the device cut, the recommendation might be "improve the checkout flow." With it, the recommendation becomes "investigate the mobile cart-to-checkout experience specifically, which accounts for the majority of users lost at the cart-to-checkout step."
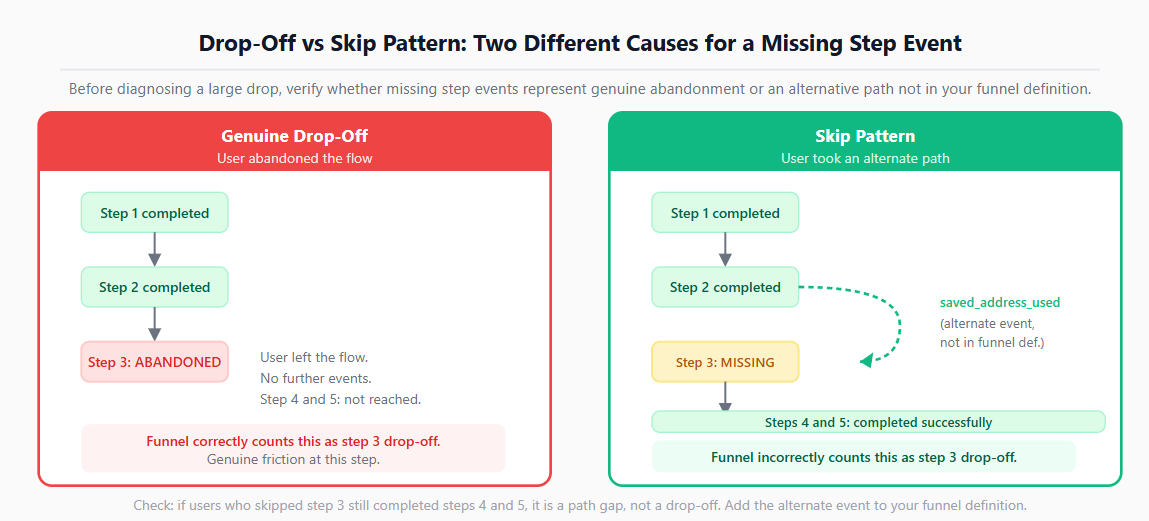
One of the most common funnel analysis mistakes is treating all missing step completions as drop-off, when some users may have skipped a step through a legitimate alternative path.
In the checkout example, some users may have a pre-saved address from a previous order and the address step fires a different event than address_submitted. If that event is not in your funnel definition, those users show as dropped at step 3, even though they successfully completed checkout.
Before diagnosing a large drop at any step, run a quick check:
sql
-- Check: of users who completed step 4 but not step 3,
-- what events did they fire between steps 2 and 4?

SELECT
  e.event_name,
  COUNT(DISTINCT e.user_id) AS user_count
FROM events e
JOIN user_steps u
  ON e.user_id = u.user_id
WHERE u.step_2 = 1    -- completed checkout start
  AND u.step_3 = 0    -- did NOT fire address_submitted
  AND u.step_4 = 1    -- but DID complete payment
  AND e.event_ts BETWEEN u.entry_ts
                    AND u.entry_ts + INTERVAL '24 hours'
GROUP BY e.event_name
ORDER BY user_count DESC;
If this query returns an event like saved_address_used with significant volume, you have found a path that bypasses your step 3 definition, not a genuine drop-off. Adding that event as an alternate step 3 trigger changes your funnel and gives you a more accurate picture of where friction actually exists.
This is the analytical work that separates a funnel that is useful from one that simply confirms the shape of the events schema.
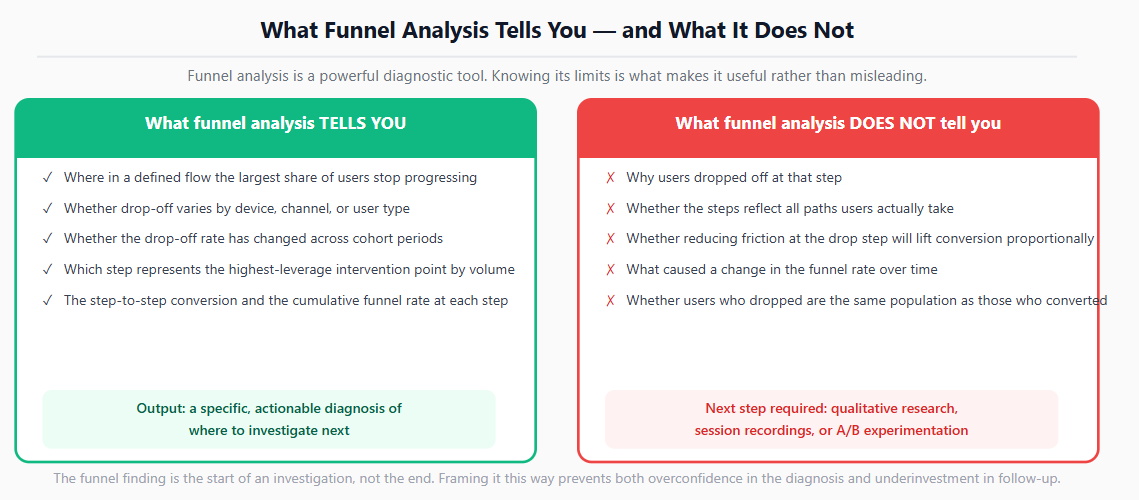
Funnel analysis is a powerful diagnostic tool and a limited one. Being clear about both matters for how you present findings and what follow-up questions you frame.
What funnel analysis tells you:
Where in a defined flow the largest proportion of users stop progressing
Whether that drop-off varies across segments (device, channel, user type, time)
Whether the drop-off has changed over time (trend analysis on the same funnel run across cohorts)
Which step is the highest-leverage intervention point based on volume and rate
What funnel analysis does not tell you:
Why users dropped off. A funnel shows you where but not why. The why requires qualitative research (session recordings, user interviews, surveys), which sits outside the funnel query itself.
Whether the funnel steps represent the actual path. If your event schema does not capture every path a user can take, the funnel reflects your instrumentation, not user behaviour.
Whether improving the drop-off step will lift overall conversion proportionally. Users who drop at step 2 may be a fundamentally different population from users who convert, and interventions that reduce friction at step 2 may not produce the conversion uplift the funnel arithmetic implies.
Causation. If mobile conversion drops in week 3 of the month, the funnel shows the drop. It does not tell you whether that drop is caused by a product change, a shift in acquisition mix, a seasonal pattern, or something else.
The funnel finding is the starting point for an investigation, not the end of one. Framing it that way when presenting to stakeholders prevents both overconfidence in the diagnosis and underinvestment in the follow-up.
Defining steps from assumptions rather than data. The most common funnel mistake is mapping the flow as someone believes it works, rather than checking the event schema to confirm what events actually fire, in what order, and with what frequency. Spend twenty minutes exploring the events table before building any funnel.
Not enforcing a time window on the lookahead. Without a lookahead limit, a user who viewed the cart in January and placed an order in August is counted as converted. This inflates conversion rates and makes the funnel meaningless for time-sensitive comparisons. Always set a window that reflects the realistic decision horizon for your flow.
Using user-level counts when session-level counts are needed. Some funnels are better measured at the session level: a user may abandon checkout on Monday and complete it on Wednesday, which is a different kind of behaviour from abandoning and never returning. The right grain depends on the question being asked.
Mixing cohort entry periods. A funnel that counts all users who ever reached step 1, across all time, is not a funnel. It is a count. The denominator must be a defined cohort entering in a defined window for the rates to be interpretable and comparable across periods.
Treating the biggest drop as the only actionable finding. The largest drop-off rate is not always the highest-leverage intervention point. A 40% drop at step 2 on desktop with 10,000 users is less urgent than a 25% drop at step 3 on mobile with 40,000 users. Calculate absolute volume of users lost at each step, not just the percentage rate, to prioritise correctly.
Not checking for skip patterns before calling it drop-off. As described above, missing step completions are not always abandonment. Always verify that the step event fires reliably for all paths through the flow before treating a missing event as evidence of user drop-off.
Understanding data quality problems that create silent errors in analysis is directly relevant here: funnel analysis is particularly vulnerable to missing events, duplicate events from instrumentation bugs, and pipeline delays that make recent steps appear under-counted. Run basic data quality checks on the events table before interpreting any funnel output.
A funnel finding that does not lead to a specific next step is a funnel finding that will be presented once and then filed away.
The structure for translating a funnel finding into action:
Name the specific step and segment. Not "mobile conversion is low" but "the cart-to-checkout step on mobile has a 13.7 percentage point lower conversion rate than desktop, accounting for a substantial number of lost conversions at current traffic volumes."
State what the funnel cannot tell you. "We know where the drop is and how large it is. We do not yet know whether the cause is the page load time, the form design, the trust signals at that step, or the user population that arrives on mobile. Determining that requires session recording review or a targeted user test."
Propose the next analytical or experimental step. "I'd recommend reviewing session recordings for mobile users who dropped at this step, and running a qualitative test with five to eight users on the mobile checkout experience. If a specific friction point is identified, we can design an A/B test to validate a fix."
This structure closes the loop between the quantitative finding and the qualitative investigation that turns it into an intervention. It also manages stakeholder expectations: a funnel tells you where to look, not what to build.
For analysts building toward more advanced analysis, funnel analysis is closely related to cohort analysis (which tracks how a group of users behaves over time after entry) and path analysis (which maps the full range of paths users take rather than evaluating a predefined sequence). Both extend the diagnostic power of a funnel finding in different directions.
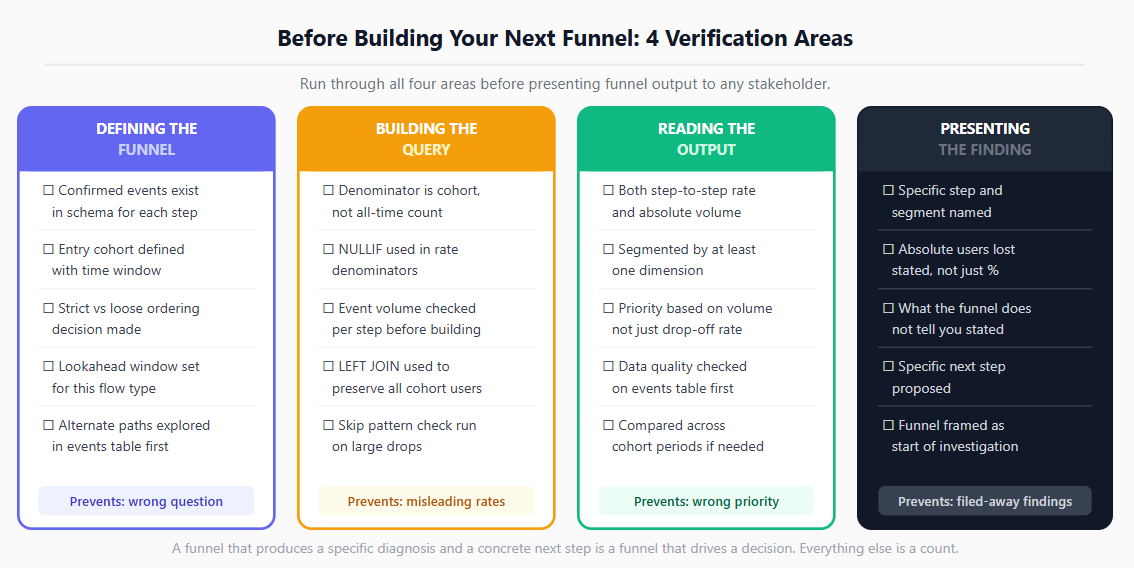
Defining the funnel
Have you confirmed which events in the schema correspond to each step, rather than assuming event names?
Have you defined the entry cohort: who qualifies, over what time window?
Have you decided whether to enforce strict step ordering or use a loose funnel, and why?
Have you set a lookahead window that reflects the realistic decision horizon for this flow?
Building the query
Is the funnel denominator a defined cohort, not a cumulative all-time count?
Have you used NULLIF in rate denominators to prevent division-by-zero errors?
Have you checked for event volume at each step before running the full analysis?
Have you checked for skip patterns at any step with an unexpectedly large drop?
Interpreting the output
Have you calculated both step-to-step rates and absolute user volume lost at each step?
Have you segmented by at least one dimension (device, channel, user type) before presenting?
Have you stated clearly what the funnel does not tell you (the why)?
Does the output include a specific proposed next step, not just a description of where drop-off occurs?
Funnel analysis is built on top of SQL. The SQL for Data Analysts guide covers the window functions, conditional aggregation, and JOIN patterns that funnel queries depend on most heavily. If your events data lives in a pandas DataFrame rather than a warehouse, the pandas fundamentals guide covers the groupby and merge operations that implement the same funnel logic in Python.
For the broader context of how funnel analysis fits into a complete analytics workflow, the Python skills every data analyst needs covers how Python-based analysis extends what SQL alone can produce, including visualisation and more flexible segmentation. And for the career context of how product analytics skills like funnel analysis position you as a candidate, the data analyst roadmap for 2026 covers where funnel and cohort analysis sit in the skill hierarchy interviewers and hiring managers actually evaluate.
Quiz
Question 1 of 15
FAQ
FREE COURSES
You'll master funnel analysis (designing funnels, calculating drop-off, segmenting, root-cause diagnosis) and cohort/retention analysis (retention tables, heatmaps, LTV curves, churn-risk signals), all reinforced with hands-on SQL and Python. The course closes with two full portfolio projects built on real datasets: an e-commerce funnel analysis and a SaaS revenue cohort analysis.
A complete, practitioner-built path into customer analytics, covering the full beginner-to-advanced journey used at real companies. You'll learn the core metrics every customer analyst relies on (CAC, CLV, retention, churn, NRR), how to segment customers with RFM and behavioral analysis, how to run cohort and funnel analysis to diagnose what's actually driving results, how to read Voice-of-Customer data like NPS and CSAT, the basics of A/B testing and experimentation, and simple predictive techniques like churn risk scoring, all using two running example businesses (a subscription app and an e-commerce retailer) so every concept builds on the last.

This hands-on Pandas course takes you from your first DataFrame to writing efficient, production-ready data analysis pipelines. Learn data cleaning, transformation, aggregation, merging, time series, reshaping, and performance optimization using one realistic e-commerce dataset. Build five complete portfolio projects covering sales, customer cohorts, inventory, revenue trends, and survey analysis. By the end, you'll confidently handle and analyze real-world data for data analyst and data science roles.