Data Analyst Career Path: From Beginner to Senior Analyst
Every level of this job is defined by who owns the question, not by how many tools sit on your resume
5 Minutes Read
Data Analytics Program — Data Analytics — Next cohort Starts Oct 24 · 35% Discount
Enroll NowEvery level of this job is defined by who owns the question, not by how many tools sit on your resume
Most career-path articles for data analysts are really tool checklists in disguise. Learn Excel, then SQL, then Power BI, then Python, then something with the word "cloud" in it, and seniority arrives on its own.
It does not work that way, and anyone who has sat in a promotion discussion knows why. Plenty of analysts write flawless window functions and never get promoted. Plenty of senior analysts write queries no more sophisticated than what they wrote in year two.
What changes across the data analyst career path is not the difficulty of the SQL. It is who owns the question.
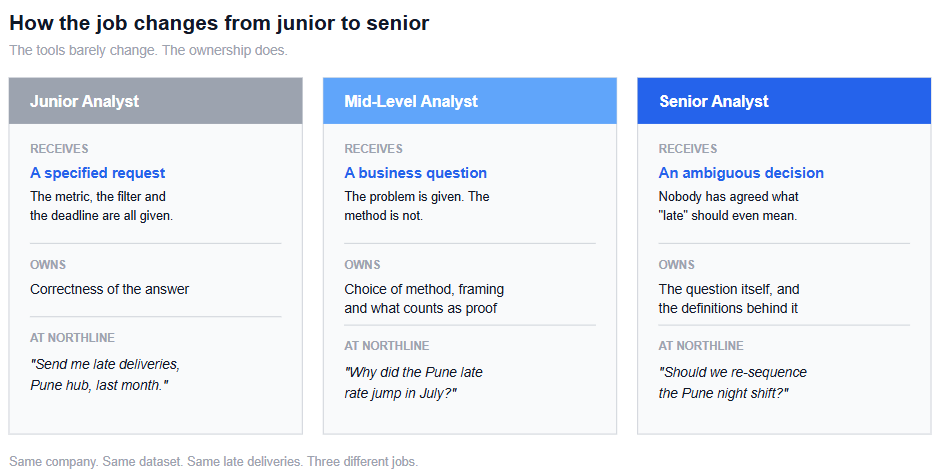
A junior analyst is handed a fully specified request and is responsible for answering it correctly. A mid-level analyst is handed a business problem and is responsible for choosing how to answer it. A senior analyst is handed an ambiguous decision and is responsible for working out what the question should even be, including what the metrics in it mean.
Every skill on the usual checklist exists to serve that progression. Learning the tools without making that shift is how an analyst spends six years being a junior analyst three times over.
This article walks the path with one company throughout: Northline, a last-mile parcel delivery business operating city hubs, with a data team of four. The same recurring problem, late deliveries at the Pune hub, follows us from the first level to the last, because the most useful way to see the difference between levels is to watch three analysts handle an identical situation.
A junior data analyst receives a fully specified request and owns the correctness of the answer. A senior data analyst receives an ambiguous decision and owns the question itself: how the metrics in it are defined, which analyses are worth doing at all, and whether the result will actually change anyone's behaviour.
Career stage | What you receive | What you own | Core skills | Evidence you are ready to progress |
|---|---|---|---|---|
Beginner | Nothing yet, you are building evidence | Your own learning and one finished project | SQL fundamentals, spreadsheets, basic statistics, data cleaning, basic visualisation | One end-to-end project you can defend for fifteen minutes, and fluent SQL on a question you were not shown in advance |
Junior analyst | A specified request: metric, filter and deadline are given | Correctness of the answer | SQL joins and aggregations, Excel or Sheets, working inside BI tools, data quality checks, stating metric definitions, communicating results | You routinely add the one breakdown nobody asked for, and it turns out to matter |
Mid-level analyst | A business question with no method attached | Choice of method, framing, and what counts as proof | Advanced SQL and window functions, exploratory analysis, statistical reasoning, data modeling, owning a dashboard or semantic model, automation where it pays | You can frame an ambiguous problem, choose the breakdowns, and explain why the analysis supports a specific decision |
Senior analyst | An ambiguous decision, often a disagreement | The question itself, the metric definitions, and what does not get analysed | Metric definition, analytical prioritisation, stakeholder management, domain knowledge, review and mentoring, reusable analytical assets | Other people's decisions and other analysts' work measurably improve because of you |
The table does not name a tool as the differentiator at any level, and that is deliberate. The tool stack is a prerequisite at every stage of data analyst career progression, not the thing that separates one stage from the next.
The hardest jump in the whole data analyst career roadmap is the one before the path starts. Once you are inside a company with data access and a queue of requests, progression has a natural engine: real problems, real feedback, real consequences. Before that, you are trying to prove capability with no work history to point at.
The useful response at this stage is not to widen your tool list. It is to make the evidence you can show unusually concrete.
SQL fundamentals. Joins, grouping, filtering, subqueries and CASE logic, applied to a question you were not shown in advance.
Excel or Sheets. Not because spreadsheets are the future, but because a great deal of real analytics work still arrives and leaves in one.
Basic statistics. Averages versus medians, variation, sample size, and why a percentage without a denominator is not an answer.
Data cleaning. Deduplication, type fixes, and handling nulls deliberately rather than accidentally.
Basic visualisation. Choosing a chart that answers the question rather than decorating the number.
One end-to-end project. Where the data came from, what was broken in it, what you excluded and why, what the answer was, and what you would do differently.
Machine learning is not required here. A statistics degree is not required. Cloud certifications are not required.
You can answer an unfamiliar question in SQL without a reference tab open for the basics.
You have one finished project you can talk about for fifteen minutes, including its flaws.
You can explain a result to someone non-technical without either dumbing it down or hiding behind jargon.
You can say out loud which rows you excluded from a number, and why.
Interview preparation is where beginners most often mis-allocate their time. The correction is to work through realistic questions early rather than the week before an interview, which is what the 50 data analyst interview questions collection is for.
Not sure what to learn first? Working through a structured Data Analytics learning path is a structured way to build the SQL, spreadsheet, BI and project skills a first analyst role actually asks for, in an order that does not leave gaps.
Your first analyst role at Northline looks like this. Requests arrive already specified. Operations wants last month's late delivery count for the Pune hub. Finance wants the same figure split by client. Someone wants the numbers refreshed in a spreadsheet every Monday.
This is genuinely useful work, and it is not beneath anyone. The skill being tested is accuracy under repetition: does your number match the source system, does it match what you produced last week, and did you handle the awkward rows correctly. Cancelled orders. Deliveries with a null promised-time. Parcels rescheduled by the customer, which arrive late but are not the courier's fault.
SQL joins and aggregations for extraction and summary
Excel or Sheets for the last mile of formatting and ad-hoc slicing
Working inside a BI tool: viewing, filtering, lightly editing existing dashboards
Data quality checks: reconciling against the source, catching duplicates, spotting a broken join
Stating metric definitions explicitly when you deliver a number
Communicating results in a sentence a non-analyst can act on
The single most valuable habit at this level is writing down your definitions. When you decide that customer-rescheduled parcels are excluded from the late count, put that in the email with the number. Many of the credibility problems analysts face later start with an undocumented judgement call made in year one.
Here is where the first real career fork appears, and it appears much earlier than most people expect.
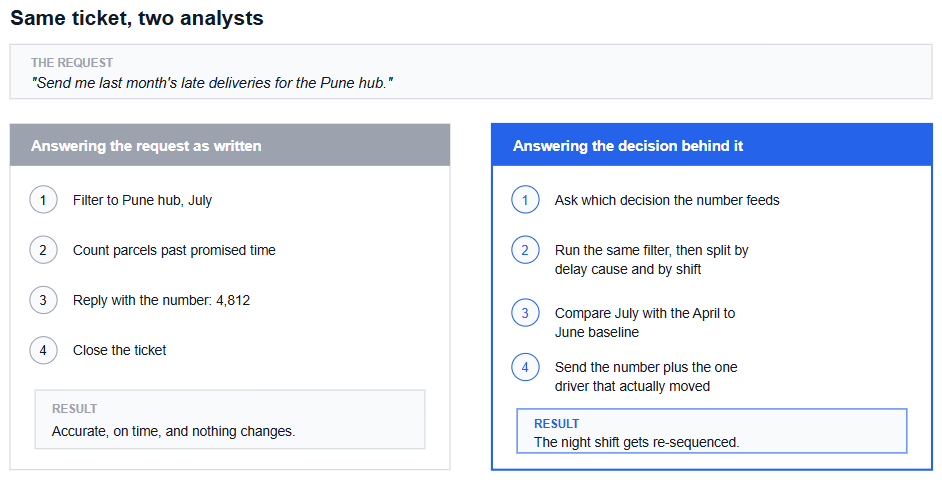
The right-hand column is not more advanced technically. It is one extra GROUP BY and one question asked before the query was written.
You can take a vague problem statement and turn it into a specific, answerable question without being coached through it.
You choose the breakdowns yourself, and they are usually the right ones.
You can explain why your analysis supports a particular decision, not just what the number was.
You notice when a result looks wrong before anyone else does.
Want practice that looks like the queue rather than a textbook? The 15 real-world business SQL problems set is close to the shape of what actually lands in a junior analyst's inbox, and it is a practical way to build the framing habit above.
You are promoted when people stop specifying requests and start describing problems. The July question at Northline is no longer "send me the count." It is "the Pune late rate jumped and nobody knows why."
Nobody tells you whether to segment by shift, by courier, by pin code, by parcel weight, by client, or by all five. Nobody tells you whether a five percentage point move is unusual or ordinary noise for a hub that size. That judgement is now yours, and being wrong about it is now your problem.
Analytical SQL, not just retrieval SQL. Comparisons over time, running totals, ranking within groups and period-over-period deltas all lean on window functions, and the reason they matter is structural rather than cosmetic. PostgreSQL's own documentation describes a window function as one that calculates across a set of rows related to the current row without grouping them into a single output row the way an ordinary aggregate would, so every row keeps its separate identity. That is precisely what you need in order to put each Pune shift next to the hub's rolling average without losing the individual deliveries.
Real exploratory discipline. Before testing an explanation, look at the shape of the data. NIST's statistical handbook frames exploratory data analysis as an approach rather than a fixed set of techniques, one that leans on mostly graphical methods to uncover underlying structure, detect outliers and anomalies, and test underlying assumptions before any model is committed to. In practice this means plotting the daily late rate before computing anything about it, because a single depot outage on 14 July looks completely different from a sustained shift in the baseline, and a monthly average hides both.
Enough statistical reasoning to know when you are fooling yourself. Sample sizes, variation, seasonality and the difference between a real move and a noisy one. You do not need to run formal tests weekly, but you do need to recognise the situations where an eyeballed comparison will mislead you. The statistics guide for data analysts covers this judgement layer, which is what separates a defensible finding from a coincidence presented confidently.
Data modeling, at least at the consumer level. Once you are building dashboards other people rely on rather than editing someone else's, the structure underneath starts determining whether your numbers stay trustworthy. Microsoft's own Power BI guidance is explicit that star schema design, which requires every model table to be classified as either a fact or a dimension, is what keeps a semantic model both performant and usable. Poorly structured models tend to get harder to maintain as more data is added, and can introduce relationship, aggregation and metric-consistency problems that were not visible while the model was small.
Automation, where it pays. Python usually enters here, though often later than people assume. It earns its place when work repeats often enough to be worth scripting, or when data gets messy or large enough that spreadsheets stop being reliable. Many strong mid-level analysts write relatively little Python, and that is generally not what is holding them back.
You have defined a metric that other people now use, and you can defend the definition under pressure.
You have told a stakeholder that their request would not change anything, and offered the question that would.
You have built something reusable, a modelled dataset or a documented definition, that removed a recurring stream of ad-hoc requests.
Your review of someone else's work catches problems before they reach a director.
The senior version of the Northline problem does not arrive as a question at all. It arrives as a disagreement.
Operations wants to add a second night shift at the Pune hub. Finance thinks the late-delivery problem is concentrated in two enterprise clients whose contracts should be repriced instead. The regional head wants to know which of them is right by Thursday.
There is no query that answers that. Before anything is computed, someone has to establish that operations and finance are using two different definitions of "late," one measured against the promised delivery window and one against the client's contractual SLA, and that the two produce materially different numbers. That reconciliation is the work. The querying afterwards is comparatively trivial.
Defining and defending metrics. Deciding what "late" means, writing it down, getting agreement, and then holding the line when a stakeholder wants a definition that flatters their function.
Choosing what not to analyse. A senior analyst kills requests. Not rudely, but by identifying which ones feed a real decision and which are curiosity dressed as urgency.
Building things that outlive the request. A well-modelled dataset or a documented metric definition removes a long tail of future ad-hoc work. That leverage is the actual justification for the salary band.
Resolving stakeholder disagreement. Two teams with two definitions is a data problem before it is a political one, and reconciling them is a senior responsibility.
Making other analysts better. Reviewing queries, catching a flawed comparison before it reaches a director, and explaining why it was flawed.
That first item deserves more weight than it usually gets. When an organisation has no agreed definition of its core metrics, dashboards disagree with each other, trust erodes, and the data team spends its time on reconciliation instead of analysis. Preventing that is a political job as much as a technical one.
Here is the triage a senior analyst runs on an incoming request, more or less automatically.
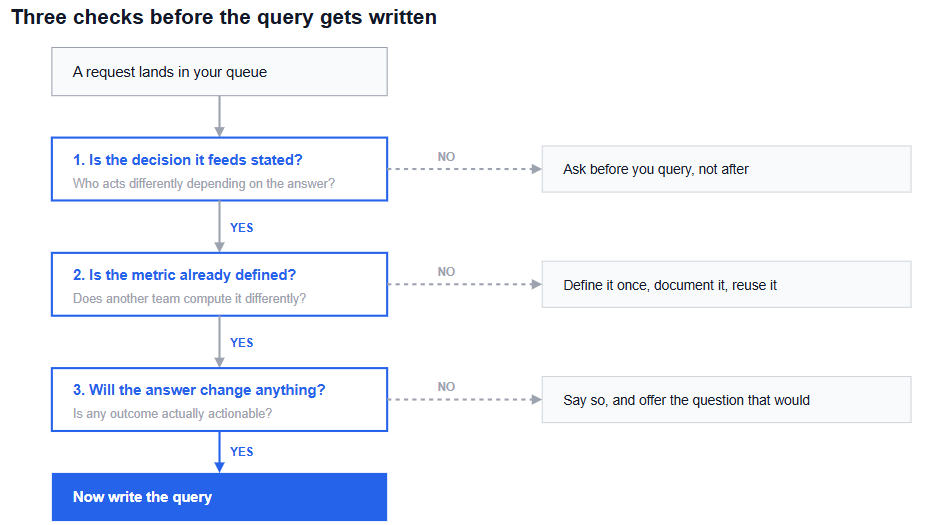
A junior analyst starts at the blue box. A senior analyst starts three checks earlier. That is the whole promotion, drawn.
Illustrative ranges, not promotion rules:
Transition | Typical range |
|---|---|
Beginner to first analyst role | approximately 6 to 12 months of focused practice |
Junior to mid-level | approximately 18 months to 3 years |
Mid-level to senior | approximately 2 to 4 years |
These are broad ranges rather than promotion requirements. Prior experience, company size, role scope, performance, and access to higher-ownership work can significantly change the timeline.
Company size tends to move these ranges more than raw ability does. A four-person data team at a company like Northline can hand a second-year analyst genuinely ambiguous work, simply because there is nobody else to own it. A larger, more layered organisation may reserve the same work for someone considerably more experienced.
That is the strongest argument for starting somewhere small. The strongest argument against it is that you may have almost nobody senior to learn from, which can mean bad habits go uncorrected for years.
Senior analyst is not a terminus, and the branches diverge more than the shared title suggests. These are career directions, not mandatory promotions, and staying a senior individual contributor is a legitimate choice rather than a stalled one.
Choose analytics engineering if... you enjoy modeling, transformation pipelines, testing and data infrastructure more than the analysis itself. If the star schema section above was the most interesting part of this article, this is your branch.
Choose product or domain analytics if... you would rather go deep in one business area than broad across tools, and you want to influence operational or product decisions directly. At Northline, this is the analyst who understands delivery operations better than most of the operations team.
Choose data science if... you want to work more deeply with prediction, experimentation, optimisation and statistical modeling. This is a change of discipline rather than a rung above senior analyst, and it usually requires real statistical depth.
Choose analytics management if... you enjoy coaching people, setting analytical priorities and improving the output of a team more than producing analysis yourself. Worth being clear-eyed: many excellent analysts try this, dislike it, and move back, which is a normal outcome rather than a failure.
It is worth separating what is reasonably observable from what is interpretation.
The observable part: current generative tools are fastest at the execution-heavy parts of analytical work, drafting an extraction query, producing a first summary, generating a chart. That is also the part that has traditionally made up most of a junior analyst's queue.
The interpretation, and it is an interpretation rather than a settled fact: as generating a plausible-looking answer gets cheaper, problem framing, validation, metric understanding and business context become increasingly important ways for an analyst to differentiate their work. Being able to tell that an answer is wrong is harder to automate than producing one.
Either way, the practical implication for the career path is the same as the argument running through this article. The ownership layer is where the durable value sits. How AI is changing the data analyst role covers what this shift does to the entry rung specifically, which matters most if you are still at level zero.
If you are a beginner: SQL, spreadsheets, basic statistics, and one finished end-to-end project. Depth in those beats shallow exposure to six tools. Finish the project before adding anything else.
If you are a junior analyst: analytical framing, data quality, communication, and solving one problem end to end without being specified to. Take the next routine request, find out what decision it feeds, and answer that instead.
If you are mid-level: metric design, statistical reasoning, data modeling, stakeholder management, and building at least one reusable asset that removes future ad-hoc work.
If you are already senior: specialisation, influence, mentoring, and a deliberate choice about which branch above you want. The risk at this level is drifting rather than choosing.
Collecting tools instead of deepening judgement. A fifth BI tool on your resume adds little. Being the person who catches a flawed comparison adds a level.
Waiting to be given the harder work. Ambiguous problems rarely get handed to someone who has never shown what they do with them. Add one unrequested, relevant breakdown to a routine request each week until it is expected of you.
Treating stakeholder communication as someone else's job. An analysis nobody acts on has roughly the business value of no analysis.
Never writing anything down. Undocumented metric definitions are how organisations lose trust in their own numbers, and the analyst who defined them silently tends to get blamed for the divergence later.
Chasing a data science title to escape a plateau. If the plateau is caused by weak business judgement, adding a model on top produces confident, expensive errors.
Optimising for the interview rather than the job. It is possible to memorise your way into a role you then struggle to keep, and the correction takes longer than the preparation would have.
If you are still at level zero, the constraint is almost always evidence rather than knowledge. Build the portfolio piece first: the 20 data analytics project ideas for beginners list is scoped for exactly this, projects small enough to finish and messy enough to have something to say about in an interview. Finishing one imperfect project beats starting four polished ones.
If you are deciding how to structure the learning itself, the trade-offs between a taught path and a self-directed one are laid out in data analytics course versus self-learning, which is worth reading before committing time in either direction rather than after.
And if you are already employed and stuck between levels, do not start with a new tool. Take the next routine request that lands in your queue, find out what decision it feeds, and answer that instead. Do it for a quarter and you will have made one of the strongest arguments you can make for promotion.
Quiz
Question 1 of 15
FAQ
FREE COURSES
A hands-on path from Python fundamentals to production-grade automation, built for data analysts. Learn to clean messy files, pull data from databases and APIs, generate automated Excel/PDF/PowerPoint reports, and schedule it all to run unattended - then go further with logging, secrets management, and workflow orchestration. Built around one consistent scenario: automating a retail company's weekly sales reporting. Closes with two full portfolio projects using real data and complete worked solutions. No prior programming experience required.
A complete, hands-on path from zero Git knowledge to running a full analytics workflow on GitHub. You'll learn how to track and undo changes safely, branch and merge without fear, collaborate with teammates through pull requests and code review, and handle the parts generic Git tutorials skip: version-controlling Jupyter notebooks and R projects, managing large data files with Git LFS, and structuring a repository so any analyst can pick it up. The course ends with two full portfolio projects: building a reviewed, documented analysis repository from scratch, and publishing an automated, GitHub Pages-hosted analytics portfolio powered by a scheduled GitHub Actions workflow.
Machine Learning for Data Analysts is a practical, hands-on course built for analysts who already know SQL, Excel, or BI tools and want to add predictive modeling to their skill set. Instead of abstract theory, every concept is taught through a single running business scenario, an online retailer named NorthPeak Outfitters, so techniques build on each other from lesson to lesson instead of feeling disconnected.