AI Native Data Analyst Course by Gradient Learnings
A module-by-module look at what an AI-native curriculum actually covers, and how to tell real AI integration from a bolted-on module
5 Minutes Read
A module-by-module look at what an AI-native curriculum actually covers, and how to tell real AI integration from a bolted-on module
"AI-native" has become a label on almost every analytics program's landing page. It rarely tells you anything about what's inside the curriculum. Gradient Learnings' Data Analytics Program uses the term to describe a specific structure: SQL, Python, Excel, and Power BI taught as before, with AI-assisted workflows built into each module rather than tacked on as a separate unit. This article breaks down what that structure looks like module by module, what analytical concepts get taught along the way, and how to check whether any program (this one included) is genuinely AI-native or just AI-labeled.
The honest answer is: less than the marketing suggests, and more than skeptics assume. AI tools change where an analyst's time goes on a task. They do not remove the need to check the logic, the grain, or the numbers before anything ships.
Consider a common analyst task: explaining a drop in a weekly metric. In a traditional workflow, an analyst writes the SQL by hand, exports results, builds a chart, and drafts a written summary from a blank page. In an AI-native workflow, the analyst drafts SQL with an AI assistant and validates the logic before running it, generates a first-pass chart and edits the annotations, and has AI draft a summary that gets fact-checked against the underlying data before it goes anywhere.
Traditional vs AI-Native Analyst WorkflowSame task: explain a 12% drop in weekly signupsTRADITIONAL WORKFLOWAI-NATIVE WORKFLOW1. Write SQL manuallyIterate through syntax errors and joins by hand2. Export and chart manuallyPull results into Excel or a BI tool, format by hand3. Write the summary from scratchDraft findings and context in a document, unaided4. Send for review, waitFeedback loop depends on reviewer availability1. Draft SQL with an AI assistantAnalyst validates logic, grain, and filters before running2. Auto-generate the chartAnalyst edits annotations and checks axis scaling3. AI drafts the summaryAnalyst fact-checks every claim against the source data4. Share with the source query attachedReviewer can re-run the logic, not just read the conclusionAI changes where analyst time goes. It does not remove the need to review the output.
The steps change. The requirement to validate output before sharing it does not.
This is the distinction Gradient's curriculum is built around, and it's also covered from a tooling angle in AI Tools for Data Analysts in 2026, which evaluates specific tools against specific analyst tasks rather than treating "AI" as one undifferentiated capability.
The program runs across nine modules plus a self-paced AI toolkit, structured so that each tool is introduced before the AI layer is applied to it. SQL comes first because most later modules (Python, dashboarding, product analytics) assume an analyst can already read and reason about a query.
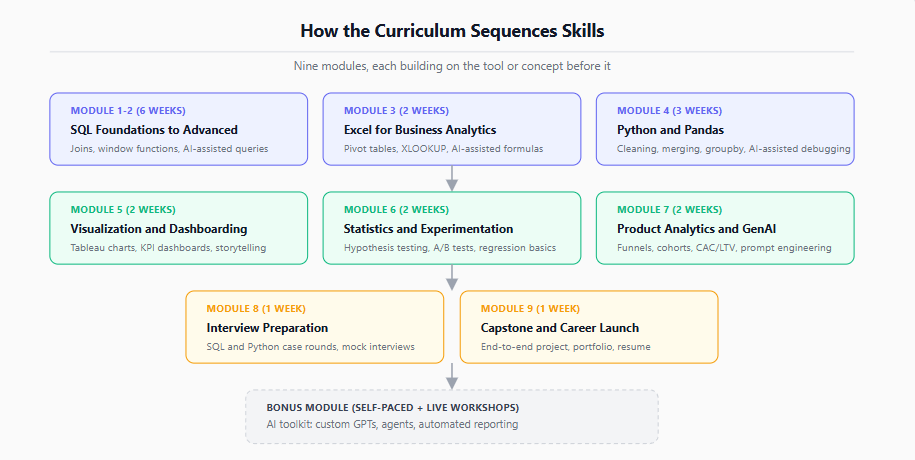
SQL and Excel come before Python. Statistics and product analytics come after the tooling is in place.
Module | Duration | Core skill | Where AI enters |
|---|---|---|---|
1–2. SQL Foundations to Advanced | 6 weeks | Joins, aggregates, window functions, query optimization | AI-assisted query drafting and debugging |
3. Excel for Business Analytics | 2 weeks | Pivot tables, XLOOKUP, dashboards | AI-assisted formulas and automated reporting |
4. Python and Pandas | 3 weeks | Data cleaning, merging, groupby | AI-assisted coding and exploratory analysis |
5. Visualization and Dashboarding | 2 weeks | Tableau, KPI dashboards, storytelling | AI-generated first-pass insights |
6. Statistics and Experimentation | 2 weeks | Hypothesis testing, A/B tests, regression | AI-assisted statistical analysis |
7. Product Analytics and GenAI | 2 weeks | Funnels, cohorts, CAC and LTV | Prompt engineering, automated EDA |
8. Interview Preparation | 1 week | Case-based SQL and Python rounds | Mock interview practice |
9. Capstone and Career Launch | 1 week | End-to-end business project | AI-generated business insights, checked by the analyst |
Most of the SQL taught in the first two modules is standard, cross-engine syntax. A common example is a running total computed with a window function:
-- Running total of weekly revenue per region
-- Standard SQL, works the same way in PostgreSQL, MySQL 8+, Snowflake, and BigQuery
SELECT
    region,
    week_start,
    revenue,
    SUM(revenue) OVER (
        PARTITION BY region
        ORDER BY week_start
        ROWS BETWEEN UNBOUNDED PRECEDING AND CURRENT ROW
    ) AS running_revenue
FROM weekly_sales;
ROWS BETWEEN frame syntax is part of the SQL standard, so it doesn't need engine-specific adaptation the way date arithmetic does. Where engines actually diverge is in date functions: PostgreSQL and Snowflake accept INTERVAL '1 month', while BigQuery expects INTERVAL 1 MONTH without quotes. This distinction is covered in more depth in SQL Patterns Every Data Analyst Should Recognize, and the official reference for window function syntax is worth bookmarking directly: PostgreSQL's window function documentation.
One pattern the curriculum flags explicitly is what happens with month-to-date comparisons:
-- Month-to-date comparison, PostgreSQL/Snowflake syntax
SELECT
    SUM(revenue) FILTER (
        WHERE order_date >= DATE_TRUNC('month', CURRENT_DATE)
    ) AS current_month_to_date,
    SUM(revenue) FILTER (
        WHERE order_date >= DATE_TRUNC('month', CURRENT_DATE) - INTERVAL '1 month'
        AND order_date < DATE_TRUNC('month', CURRENT_DATE)
    ) AS prior_month_full
FROM orders;
Why this matters: current_month_to_date only reflects the days elapsed so far this month, while prior_month_full covers a complete month. Comparing the two directly will understate growth early in the month and can mislead a stakeholder reading the number at face value. Restrict both sides to completed periods, or label the current-month figure explicitly as month-to-date.
A second pattern worth knowing before relying on AI-generated SQL is what happens with NOT IN and NULLs:
-- Dangerous if orders.customer_id can contain NULL
SELECT customer_id
FROM customers
WHERE customer_id NOT IN (SELECT customer_id FROM orders);
If orders.customer_id contains even one NULL value, this query returns zero rows for the entire table, not a partial result. That's a NULL-handling property of NOT IN, separate from any performance difference between IN and EXISTS. The safer rewrite:
SELECT c.customer_id
FROM customers c
WHERE NOT EXISTS (
    SELECT 1 FROM orders o WHERE o.customer_id = c.customer_id
);
IN tests membership in the subquery result, while EXISTS tests whether at least one matching row exists for the correlated condition. Query optimizers may transform either form into the other, so treating one as categorically faster without checking an execution plan is a claim the data usually doesn't support.
For deduplication (getting each customer's most recent order, for example), the cross-engine approach taught is ROW_NUMBER() rather than Oracle-specific syntax like KEEP (DENSE_RANK FIRST ORDER BY ...):
SELECT *
FROM (
    SELECT
        o.*,
        ROW_NUMBER() OVER (
            PARTITION BY customer_id ORDER BY order_date DESC
        ) AS rn
    FROM orders o
) ranked
WHERE rn = 1;
It's worth being precise about grain here: the inner query still operates on order-level rows. The filter to rn = 1 is what reduces the result to one row per customer, not the SELECT itself.
Module 4 introduces Python and pandas for the same kind of work, with a similar emphasis on validating what a library actually does rather than assuming it. A common starting point is reading a spreadsheet:
import pandas as pd

# openpyxl is the engine for the .xlsx format specifically,
# not a universal handler for every Excel file type
orders = pd.read_excel("orders.xlsx", engine="openpyxl")
Date parsing is another place where assumptions cause quiet errors:
# Specify format explicitly. Without it, an ambiguous date like
# 02/03/2026 can be parsed as Feb 3 or Mar 2 depending on inference
orders["order_date"] = pd.to_datetime(orders["order_date"], format="%d/%m/%Y")
A related caution the course covers: if a numeric-looking column has been read in as an object dtype (commonly because a currency symbol or stray text slipped into a few rows), arithmetic on it doesn't behave one predictable way. Depending on the column's actual contents, it can raise a TypeError, produce an unexpected implicit cast, or in some cases return NaN. Checking dtypes before aggregating is the habit that catches this, more reliably than assuming any single failure mode. The pandas documentation on groupby operations and handling missing data are both referenced directly in the module. Pandas Basics for Data Analysts covers the same DataFrame and indexing fundamentals in more detail for anyone starting from zero.
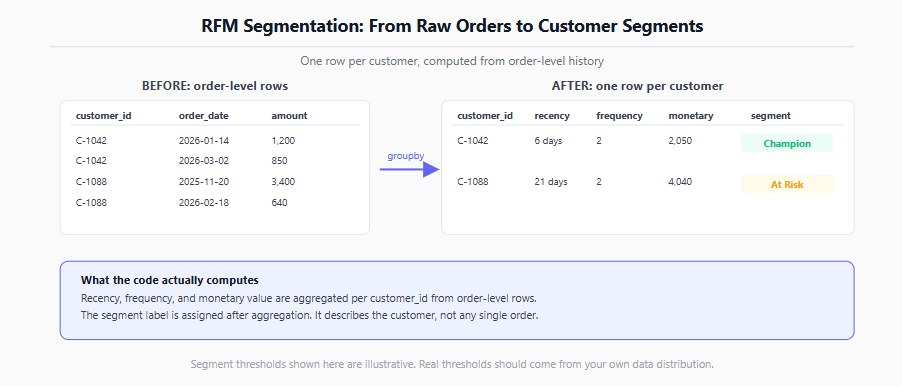
Module 7 moves from tool mechanics to business framing. One example the course builds around is RFM segmentation, which is a customer-level metric computed from order-level history:
rfm = orders.groupby("customer_id").agg(
    recency=("order_date", lambda x: (reference_date - x.max()).days),
    frequency=("order_id", "count"),
    monetary=("amount", "sum")
).reset_index()
Funnel analysis gets a similar precision check. A strict, sequential funnel definition is more precise for the exact sequence it defines, not inherently more accurate than a looser definition if the product genuinely allows customers to convert through legitimate alternate paths. Choosing between the two is a modeling decision, not a correctness one. Funnel Analysis: Finding Where Customers Drop Off walks through this distinction with a fuller worked example.
Because the label is unregulated, it's worth having a checklist that works regardless of which program you're evaluating, Gradient's or anyone else's.
Is a Program Actually AI-Native, or AI-Labeled?Four questions to ask before comparing curricula1Is AI built into every module, or one bolt-on session at the end?Look for AI-assisted SQL, Python, and Excel inside the core modules, not a single separate "AI tools" lecture.2Are you still asked to validate the AI's output?A program that skips validation teaches prompt copying, not analysis. Check whether assignments require you to check logic and grain.3Are the core fundamentals (SQL, statistics, dashboarding) still taught in full?AI tooling should sit on top of fundamentals, not replace the weeks that build them. Ask to see the module-by-module curriculum.!Red flag: projects that only require prompting, never a query or formula you wroteIf a capstone can be finished without writing any SQL, Python, or Excel logic yourself, the AI layer has no foundation underneath it.
The gates that separate AI integration from an AI-labeled bolt-on module.
Question to ask | What a genuine answer looks like |
|---|---|
Is AI built into every module, or one module at the end? | AI-assisted work appears inside SQL, Python, and Excel modules, not only in a separate unit |
Are you still required to validate the AI's output? | Assignments ask you to check logic, grain, and correctness before submission |
Are fundamentals still taught in full? | SQL, statistics, and dashboarding retain dedicated weeks, not just a summary |
Can the capstone be finished by prompting alone? | If yes, the AI layer has no analytical foundation underneath it |
Gradient publishes a direct comparison against what it categorizes as typical data analytics programs, on its own program page. These are the company's stated claims about itself and its category, not independently audited figures, so they're worth treating as a starting point for questions to an advisor rather than settled fact.
Curriculum Depth vs AI Integration, Side by SideAs published on Gradient Learnings' own program comparison pageTYPICAL DA PROGRAMGRADIENT LEARNINGSAI integrationOne "AI tools" module, added at the endAI-assisted work built into every moduleTools covered4 to 5 core tools15+ tools, including SQL, Python, Power BI, Tableau, ExcelProjects3 to 5 guided practice projects4+ business projects plus an AI-powered capstoneMock interviews1 to 2 scheduled mocksUnlimited mock interviews, including after the program endsBatch size100+ learners per batch30 learners per batchPlacement support windowEnds with the cohortUp to 1 year after completion, per current program termsThese figures are Gradient's own published claims about its program and its category.Verify current terms on the program page before enrolling, since cohort details change over time.
Published by Gradient Learnings on its own program comparison page.
The program's published pricing for the current cohort is listed at a discounted rate against a higher list price, exclusive of GST, with a no-cost EMI option available at checkout. The company also reports an average outcome metric (a stated average salary figure) and a placement rate within six months on its results page. Because these are self-reported program statistics rather than figures verified by a third party, the most reliable way to check current numbers is the program's own pricing and outcomes section, which updates per cohort.
Assuming AI reduces the SQL or Python you need to know. Every module above still requires enough fundamentals to check what the AI produced.
Treating self-reported outcome stats as guarantees. Average salary and placement figures describe past cohorts under specific conditions, not a promise for any individual learner.
Skipping the curriculum PDF. Marketing pages summarize; the module-by-module breakdown is where you can actually check whether fundamentals got cut to make room for an AI module.
Assuming SQL syntax is portable without checking. Window function syntax like ROWS BETWEEN travels well across engines; date functions like DATE_TRUNC and INTERVAL often don't.
Judging a funnel or segmentation model as "wrong" instead of asking what grain and definition it was built for.
Request the full module-by-module curriculum, not just the marketing outline.
Ask for a sample assignment that includes AI assistance, and check whether it also requires validation work.
Confirm which SQL and Python fundamentals are covered before any AI tooling is introduced.
Ask what happens to the capstone if a learner can't write the underlying query or code themselves.
Verify current pricing, cohort dates, and placement support terms directly on the program page, since these change per cohort.
If SQL is the part you want to strengthen before anything else, SQL for Data Analysts: Essential Skills and Query Guide covers the skills that show up most often in analyst interviews. For the Python side, Python Skills Every Data Analyst Needs to Know is a useful next stop, and Pandas Basics for Data Analysts goes deeper on the DataFrame operations referenced above. If you're earlier in the decision (should you become a data analyst at all, and how), How to Become a Data Analyst in India: 2026 Guide is the broader starting point. And for a tool-by-tool evaluation of what's actually worth using right now, AI and GenAI Tools Changing Analytics Workflows covers where AI genuinely speeds up analytics work and where it doesn't yet.
FAQ