AI for Python Data Analysis: A Practical Workflow
How to integrate AI assistants into every stage of a Python analysis project without losing analytical rigour
6 Minutes Read
Data Analytics Program — Data Analytics — Next cohort Starts Oct 24 · 35% Discount
Enroll NowHow to integrate AI assistants into every stage of a Python analysis project without losing analytical rigour
Most analysts who try AI tools for the first time use them the same way: open a chat window, paste some code that is not working, and ask what is wrong. That is useful, but it captures maybe ten percent of what AI tools can do inside a Python analysis workflow.
The more productive frame is to treat an AI assistant as a collaborator who is extremely fast at writing boilerplate code, strong at explaining error messages, and genuinely useful for drafting first versions of almost anything structural. That collaborator also makes confident mistakes, hallucinates column names, and has no idea what your business means by "revenue." You review everything before it goes into a deliverable.
This article walks through a six-stage analysis workflow and shows precisely where AI assistance accelerates the work, what prompts produce useful output, and which decisions must stay with the analyst. The running example is SalesPulse, a SaaS subscription dataset with columns for customer_id, plan_type, mrr (monthly recurring revenue), signup_date, churn_date, and channel.
Before diving into each stage, the diagram below maps the full workflow and marks which stages are AI-led, AI-assisted with analyst verification, and analyst-led with optional AI drafting.
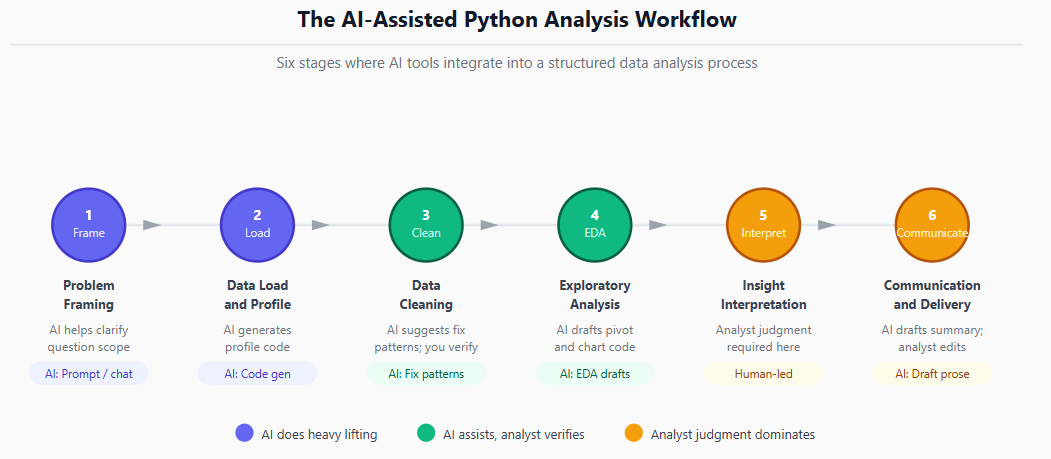
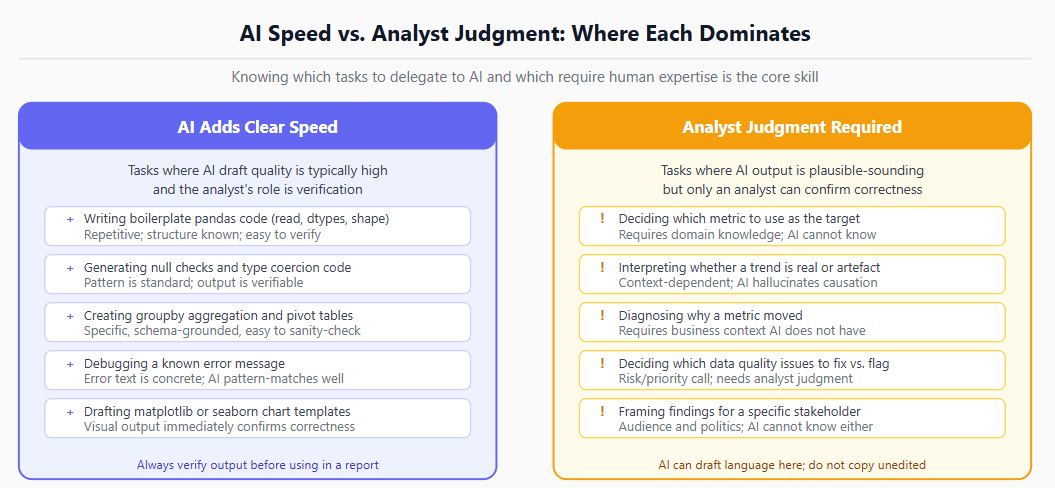
The distinction matters practically. Stages 1 and 2 (problem framing and data loading) are where AI can scaffold the structure of your work quickly. Stages 3 and 4 (cleaning and EDA) are the most productive collaboration zone: AI drafts code, the analyst verifies and adjusts. Stages 5 and 6 (interpretation and communication) require domain-anchored judgment that AI cannot supply, though it can draft prose for the analyst to edit.
The analyst's task: translate a business request into a precise analytical question with a defined output.
This is the stage most analysts skip when working with AI, and it is the one that determines whether every subsequent prompt produces useful output. A vague business request fed directly into an AI chat produces vague code.
The SalesPulse scenario: the Head of Growth asks "why are we losing subscribers?" That is not yet an analytical question. Before writing any code, use the AI to sharpen it:
Effective framing prompt:
I'm a data analyst at a SaaS company. A stakeholder has asked:
"Why are we losing subscribers?"

I have a dataset with these columns:
- customer_id, plan_type (basic/pro/enterprise), mrr (float),
  signup_date (date), churn_date (date, null if active),
  channel (str: organic/paid/referral)

Help me break this business question into three precise
analytical questions I can answer with this dataset.
A well-structured prompt like this consistently produces output that identifies separable questions: churn rate by plan type over time, time-to-churn by acquisition channel, and MRR loss concentration by segment. Each of those is a specific query you can write.
The framing stage is also where you establish the vocabulary for every prompt that follows in this session. State your column names, their types, and what they mean in business terms once, at the start, and subsequent prompts require far less context-setting.
The analyst's task: load the dataset, confirm its shape, and run an initial profile to identify structural and completeness issues before analysis begins.
This is the highest-leverage stage for AI code generation. Loading data and generating profile statistics is entirely pattern-based work. The structure of the code is often similar across datasets; only the file path, column names, and types change.
Prompt:
Write Python pandas code to:
1. Load a CSV called salepulse.csv into a DataFrame called df
2. Print shape, dtypes, and first 5 rows
3. Print a null count and null percentage for every column
4. Print value_counts() for plan_type and channel

Use pandas only. No external libraries.
A prompt this specific is much more likely to produce a useful first draft. The AI fills in the standard pandas patterns; the analyst supplies the file name and column context, and verifies before running.
Expected output (after running and verifying):
python
import pandas as pd

df = pd.read_csv('salespulse.csv', parse_dates=['signup_date', 'churn_date'])

print("Shape:", df.shape)
print("\nData types:\n", df.dtypes)
print("\nFirst 5 rows:\n", df.head())

null_summary = pd.DataFrame({
    'null_count': df.isnull().sum(),
    'null_pct':   df.isnull().mean().mul(100).round(2)
}).sort_values('null_pct', ascending=False)
print("\nNull summary:\n", null_summary)

print("\nplan_type distribution:\n", df['plan_type'].value_counts())
print("\nchannel distribution:\n",  df['channel'].value_counts())
The parse_dates argument at load time is worth noting: if you do not specify it in the prompt, AI-generated code often loads date columns as strings, which then requires additional coercion. Always include the date column names in your profiling prompt.
For the broader pandas functionality used throughout this stage, the official pandas IO tools documentation covers read_csv parameters including encoding, date parsing, and type specification.
The analyst's task: identify and resolve data quality problems before any analytical queries run.
This stage requires a split responsibility. AI is fast at generating the cleaning code patterns once you have told it what the problem is. The analyst must still decide which problems exist and which treatment is correct. Never ask AI to "clean the data": it will produce generic code for common issues that may not reflect what is actually wrong with your specific dataset.
The correct approach is to run the profile from Stage 2 first, identify specific issues, then prompt for targeted fixes.
Prompt for a specific cleaning task:
My SalesPulse DataFrame df has these issues:
1. channel has 340 rows with value "unknown" (placeholder null)
2. mrr has 12 negative values (returns, should be set to null)
3. plan_type has mixed casing: "Basic", "basic", "BASIC"

Write pandas code to fix all three. Do not drop any rows.
Add a boolean column 'data_quality_flag' = True for any row
that had at least one of these issues.
Specifying "do not drop any rows" and asking for an audit flag are discipline choices the analyst makes, not things AI applies by default. The resulting code will reflect exactly those constraints.
python
import numpy as np

# Step 1: Create the audit flag BEFORE cleaning, based on the
# specific conditions in the prompt, not on post-clean NULLs.
# The casing check must run before standardisation; once .str.lower()
# is applied the original variation is gone.
# .fillna(False) guards against NaN in plan_type raising a TypeError.
df['data_quality_flag'] = (
    df['channel'].eq('unknown') |
    df['mrr'].lt(0) |
    df['plan_type'].ne(
        df['plan_type'].str.strip().str.lower()
    ).fillna(False)
)

# Step 2: Apply the cleaning transformations
# Fix 1: Replace placeholder null in channel
df['channel'] = df['channel'].replace('unknown', np.nan)

# Fix 2: Null out negative MRR (returns on standard orders)
df.loc[df['mrr'] < 0, 'mrr'] = np.nan

# Fix 3: Standardise plan_type casing
df['plan_type'] = df['plan_type'].str.strip().str.lower()
Two things to notice about the ordering above. The audit flag is created first, before any transformation runs, because the casing problem is only detectable in the original values: once .str.lower() is applied the distinction between "Basic" and "basic" is gone. Checking channel.isna() after the replace would also flag pre-existing NULLs unrelated to the three specified issues; checking channel.eq('unknown') before the replace flags only the exact problem identified.
After running AI-generated cleaning code, always verify with a before/after null count and a value_counts() on the corrected columns. The code may be correct in structure but wrong in its assumption about what "unknown" means in your specific dataset.
For analysts moving from Excel to Python cleaning workflows, the Gradient Learnings guide on when to switch from pandas to Python explains which cleaning tasks become substantially easier in a programmatic environment.
The analyst's task: build the queries and visualisations that answer the specific analytical questions from Stage 1.
This is where the collaboration becomes most productive. The analyst has clean data, well-defined questions, and a schema the AI now knows from the framing prompt. Generating groupby tables, cohort analyses, and chart code is fast and reliable when the prompt is specific.
Prompt for churn rate by plan type and month:
Using my SalesPulse DataFrame df with columns:
customer_id, plan_type (str), mrr (float),
signup_date (datetime), churn_date (datetime, NaT if active)

Write pandas code to:
1. For each calendar month, identify customers who were active
   at the start of that month (signed up before it, not yet
   churned before it): this is the denominator.
2. Of those customers, count how many churned during that month
   (churn_date falls within the month): this is the numerator.
3. Calculate monthly churn rate = churned / active_at_start,
   grouped by plan_type.
4. Plot as a matplotlib line chart, one line per plan_type,
   x-axis as month, y-axis as churn rate (0.0 to 1.0 scale).
The denominator definition is the most consequential decision in any churn rate calculation, and it must be explicit in the prompt. Grouping by churn month alone gives churned customer counts by period, which is not the same as a rate. The rate requires a denominator of customers who were at risk during that period. The exact definition of "at risk" varies by company (some exclude customers in trial, some exclude customers on pause), so the analyst must confirm that the prompt's denominator logic matches the business convention before using the output.
The resulting code will handle the NaT detection and the dt.to_period('M') extraction correctly when the prompt is this specific. Verify that the denominator behaves correctly for the first and last month of the dataset, where partial-period counts can distort the rate.
Where AI assistance fails in EDA: the analyst must never accept an AI-generated interpretation of what a chart shows. If monthly churn for the Pro plan spikes in October, AI can observe the spike; it cannot know whether that spike reflects a price increase, a product bug, a seasonal pattern, or a data pipeline delay. That diagnosis is the core analytical work and it belongs to the analyst.
The Gradient Learnings overview of AI and GenAI tools changing analytics workflows covers a broader perspective on where this class of tools is reshaping analyst work versus where the fundamentals remain unchanged.
Prompt for a cohort retention table:
Using df with signup_date and churn_date (NaT if active),
and a dataset cutoff date stored as CUTOFF_DATE:
Write pandas code to:
1. Assign each customer a signup cohort = month of signup_date
2. For each cohort, calculate what fraction of customers
   remained active at months 1, 3, 6, and 12 post-signup.
3. For each retention point (e.g. month 12), only include
   customers whose signup_date is at least 12 months before
   CUTOFF_DATE in the denominator. Customers without enough
   observation time must be excluded from that column, not
   counted as churned.
4. Return as a DataFrame with cohort as index and
   months as columns (values between 0.0 and 1.0,
   NaN where the cohort has not yet reached that age).
The right-censoring requirement in step 3 is the most analytically significant constraint, and it is one that AI omits by default. Without it, customers who signed up three months ago are treated as if they had 12 months of observation time: since they have not churned yet, they appear as retained at month 12, which overstates retention for recent cohorts. The CUTOFF_DATE variable should be set to the maximum signup_date in the dataset, or to the date of the data extract, whichever better reflects the end of the observation window.
The analyst also verifies that "remained active" aligns with the business definition (is a customer on a pause considered active?), which AI has no way to know.
The analyst's task: determine what the data findings actually mean for the business, which findings are reliable, and what action they suggest.
This stage is not where AI adds structural speed. It is where the analyst's domain knowledge, familiarity with the business context, and understanding of data limitations produce value that cannot be delegated.
AI can be useful here in a narrow way: as a thinking prompt. Describe a finding and ask the AI to generate a list of alternative explanations. Then use the data to rule alternatives in or out. This is not the AI doing the diagnostic work; it is the AI helping the analyst be systematic about hypothesis generation.
Prompt for hypothesis generation (not for conclusions):
I found that SaaS churn rate for the Basic plan is 3x higher
than for the Pro plan in months 1 and 2 post-signup.

Generate five plausible business hypotheses that could explain
this pattern. Do not state which is most likely. I will test
each one against the data.
That prompt yields a structured list to investigate, not a conclusion to adopt. The analyst then tests each hypothesis with actual data. The conclusion belongs to the analyst.
What to avoid: asking AI to "explain what this chart shows" or "tell me why churn is high" and treating the response as analysis. AI will generate a plausible-sounding narrative. That narrative is not grounded in your business context, your data quality issues, or anything your stakeholders have told you. It is a pattern-matched text response.
The analyst's task: structure findings clearly, translate them into business language, and frame recommendations for the relevant audience.
AI is genuinely useful as a prose drafting assistant at this stage, particularly for converting bullet-point findings into structured paragraphs. The constraint is the same as throughout: the analyst must edit the draft, not publish it unreviewed.
Prompt for drafting an insight summary:
I'm a data analyst presenting findings to the Head of Growth.

Key findings:
- Basic plan 30-day churn is 18%, versus 6% for Pro
- 65% of churned Basic customers churned within 14 days
  of signup (suggests onboarding failure, not value failure)
- Paid acquisition channel has 2x the churn rate of organic

Write a three-paragraph executive summary. Confident,
specific, no filler. End with one recommended next action.
Do not start with "In today's competitive landscape" or
any generic opener.
The resulting draft will be structurally sound and grammatically clean. The analyst verifies every specific number, removes any interpretations the data does not support, and adjusts the recommendation to reflect constraints AI does not know about (budget, team capacity, existing roadmap).
For guidance on framing difficult data findings clearly for senior stakeholders, the Gradient Learnings article on presenting bad news from analysis covers the communication structure directly.
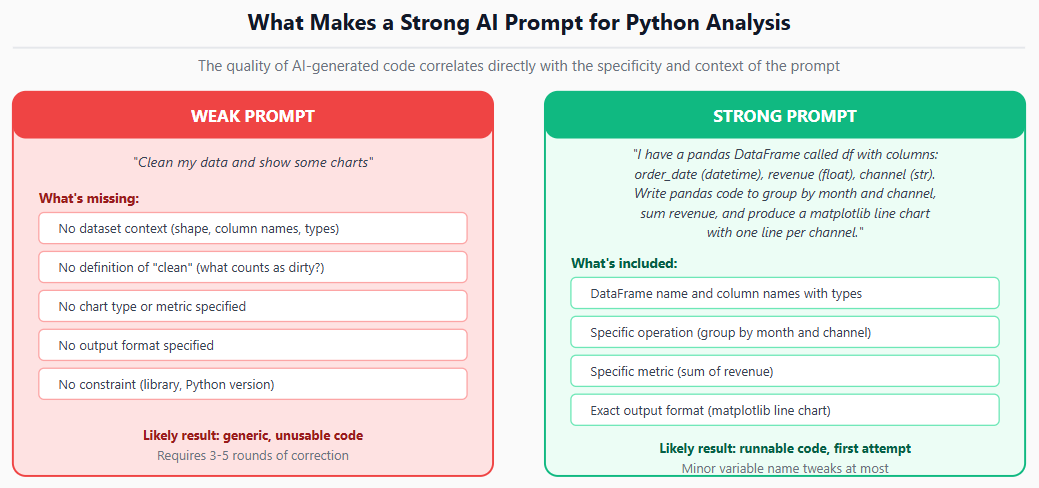
The quality of AI output in a Python analysis workflow is almost entirely determined by the quality of the prompt. Vague prompts produce generic code. Specific, schema-grounded prompts produce directly usable code.
Five rules for prompts that produce usable Python analysis code:
Rule 1: Always name the DataFrame and column names with their types. The AI cannot infer your schema. State it explicitly in every prompt that involves data manipulation.
Rule 2: Specify the exact operation, not the goal. "Analyse the data" produces nothing useful. "Group by plan_type, sum mrr, sort descending" produces working code.
Rule 3: State the output format. "Return a DataFrame" versus "return a single float" versus "produce a matplotlib figure" changes the code structure substantially.
Rule 4: Name constraints explicitly. "Use pandas only," "do not use external libraries," "Python 3.10 compatible," "do not modify the original DataFrame." Constraints that are obvious to you are not obvious to the AI.
Rule 5: Ask for one thing per prompt. Multi-step prompts that ask for cleaning, analysis, and visualisation in one request produce interleaved code that is hard to debug. Break it into sequential prompts and verify each step before moving to the next.
Most problems with AI-assisted Python analysis fall into two categories: code that runs but produces analytically wrong results, and code that the analyst trusted without verification.
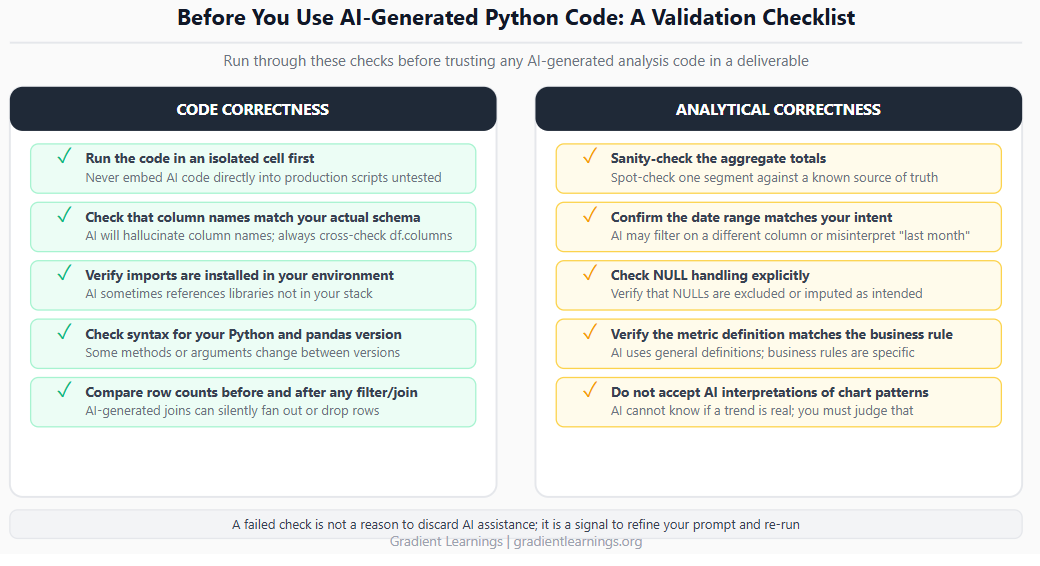
The five most common mistakes analysts make with AI-assisted Python work:
Mistake 1: Trusting column names AI generates. AI will hallucinate column names that sound plausible for your domain. Always cross-check every column reference against df.columns before running the code.
Mistake 2: Skipping the row-count sanity check. Any AI-generated join or filter should be followed immediately by print(len(df_result)) compared to print(len(df)). Fan-out and unexpected filtering are the most common silent errors in AI-generated join code.
Mistake 3: Accepting AI-generated date logic without testing. "Last month," "year to date," and "rolling 30 days" are interpreted differently by AI depending on how the prompt is phrased. Always print the min and max date in any filtered result.
Mistake 4: Using AI to interpret findings rather than to generate hypotheses. AI interpretations are plausible, not grounded. Use AI to generate alternative explanations; use data to eliminate them.
Mistake 5: Regenerating code when a targeted fix prompt would work. When AI-generated code has a specific bug, do not discard it and start over. Paste the error message and the relevant code back into the chat and ask for a targeted fix. Error messages are concrete input that AI handles well.
For analysts who are still building foundational Python skills alongside this AI-assisted workflow, the Gradient Learnings Python skills guide for data analysts covers the core competencies that make AI collaboration more effective. Understanding what the generated code does, rather than treating it as a black box, is what allows the analyst to catch errors before they reach a deliverable.
For foundational pandas skills that make it easier to verify and adapt AI-generated code, the pandas basics for data analysts guide is the right reference.
For the broader picture of which AI tools are changing analyst workflows beyond code generation, the Gradient Learnings AI tools for data analysts overview covers the current landscape.
For building AI-powered analysis scripts using an API rather than a chat interface, the Anthropic API documentation covers how to call Claude programmatically, which opens up automation patterns that go beyond interactive prompting.
For visualisation code that complements the EDA stage, the scikit-learn documentation is the reference for any machine learning components you add downstream of exploratory work.
The Jupyter documentation covers notebook environments where the interactive cell-by-cell execution model pairs particularly well with the verify-each-step approach to AI-assisted analysis.
Quiz
Question 1 of 15
FAQ
FREE COURSES

This project-driven course takes you from zero Python experience to job-ready data analyst skills. Learn Python, NumPy, pandas, visualization, EDA, statistics, databases, automation, and practical machine learning through a real-world business scenario. Build five end-to-end portfolio projects across retail, churn, marketing, finance, and HR analytics. Finish with career guidance, role expectations, and current compensation insights to prepare for the job market.
A hands-on path from Python fundamentals to production-grade automation, built for data analysts. Learn to clean messy files, pull data from databases and APIs, generate automated Excel/PDF/PowerPoint reports, and schedule it all to run unattended - then go further with logging, secrets management, and workflow orchestration. Built around one consistent scenario: automating a retail company's weekly sales reporting. Closes with two full portfolio projects using real data and complete worked solutions. No prior programming experience required.
Learn to create clear, professional data visualizations in Python using Pandas, Matplotlib, Seaborn, Plotly, Streamlit, and Dash with practical projects and real-world business scenarios.