Data Validation Checks Every Analyst Should Know
The checks are ordered by how cheaply they run, because the point is to fail before you have wasted a week, not after
5 Minutes Read
Data Analytics Program — Data Analytics — Next cohort Starts Oct 24 · 35% Discount
Enroll NowThe checks are ordered by how cheaply they run, because the point is to fail before you have wasted a week, not after
Validation and cleaning get treated as the same activity, and they are not. Cleaning is what you do to data once you know what is wrong with it. Validation is the earlier and more important step of asserting what must be true, running that assertion, and being told when it fails. One is a repair job. The other is a smoke alarm.
The reason this distinction matters is that bad data almost never announces itself. Data that is obviously broken gets caught by anyone. The failures that reach a board deck are the ones where every number is a plausible number: the total is a bit lower than expected, the average has drifted, the trend line bends slightly. No error is raised, because nothing errored. Something was silently missing, silently duplicated, or silently dropped by a join.
The running example is Saffron, a food delivery marketplace operating in eleven cities. The main table is orders, one row per customer order, with order_id, customer_id, restaurant_id, city, placed_at, delivered_at, item_total, discount, delivery_fee, and payment_status. Two dimension tables sit beside it: restaurants and customers. Every check below is shown against that dataset.
The single most useful habit is doing these in sequence rather than picking whichever occurs to you. The cheap checks catch the catastrophic problems, and there is no point reconciling a total to the penny if half the file failed to load.
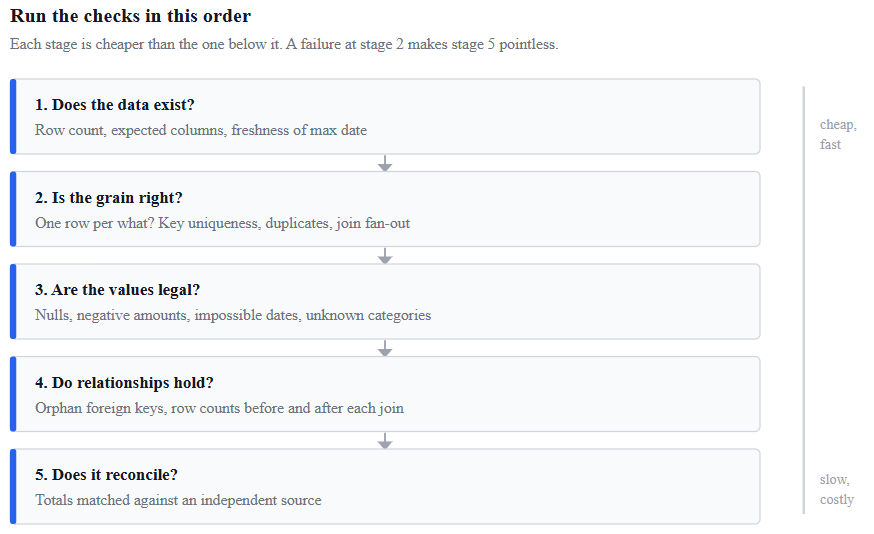
Three checks, none of which takes more than a minute.
Row count against expectation. Not "is the row count non-zero" but "is it in the range I would expect." Saffron does somewhere between 180,000 and 240,000 orders a week. A file with 31,000 rows is not empty, it is truncated, and it will produce a perfectly renderable chart showing a catastrophic collapse in demand that never happened. Get in the habit of writing the expected range down before you look.
Expected columns present, with expected types. Upstream teams rename things. If delivery_fee arrives as text because one row contained "N/A", every sum involving it either errors or, worse, coerces silently to zero.
Freshness. Check MAX(placed_at) against the clock. A pipeline that stopped three days ago returns a complete, valid, internally consistent dataset that is simply wrong about the present. This is the check most often missing from otherwise careful work, because a stale extract looks identical to a fresh one.
Grain means "one row represents what, exactly." Getting this wrong is the single most expensive validation failure, because it inflates or deflates every aggregate you will ever compute from the table without breaking anything.
Key uniqueness. Count rows and count distinct order_id. If they differ, you have duplicates. At Saffron this happened when a backfill job was re-run and inserted a partial day twice: revenue for that Tuesday was 2 percent high, which nobody questioned for six weeks. The relational-database version of this assertion is a primary key or unique constraint, and it is worth understanding those properly, because a warehouse table often has no enforced constraints at all. PostgreSQL's own documentation on constraints walks through the whole family, including CHECK constraints for things like requiring a price to be positive, which is exactly the class of rule analysts end up re-implementing by hand in a query.
Composite grain. Some tables are unique only on a combination. A daily restaurant summary is one row per restaurant_id and date, not per restaurant_id. Test the combination, not the column you assume is the key.
Join fan-out. Record the row count before a join and after it. If orders has 210,000 rows and orders joined to restaurants has 214,300, then some restaurants appear more than once in the dimension table, probably because it holds a history of address changes. Every downstream sum is now inflated for those restaurants only, which is far harder to spot than an across-the-board error. If the relationship between fact and dimension tables is unfamiliar territory, databases, data warehouses and data types explained for analysts covers the structures that make this failure mode predictable rather than mysterious.
Null rate per column, compared with last time. The absolute number matters less than the change. If delivered_at was 3 percent null last month and is 19 percent null now, something happened, and it is likely an upstream schema change rather than a sudden collapse in deliveries.
Nulls also behave in ways that surprise people writing filters. SQL is a three-valued logic system, and PostgreSQL's documentation spells out the truth tables: null means unknown, so a comparison against null yields null rather than false. The practical consequence is that WHERE payment_status != 'failed' silently excludes every row where payment_status is null. You did not filter them out on purpose, but they are gone.
Distinguish missing from zero. A discount of 0 means no discount was applied. A discount of null means the field was not populated, which could mean anything. Collapsing the two with a blanket fill of zero is a decision, not a cleanup, and it should be made consciously.
Range checks. item_total should be positive. delivery_fee should sit within a plausible band. delivered_at should be after placed_at, which sounds too obvious to test until you find 400 orders where it is not, all from one city, all in a two-hour window during a clock change.
Domain checks on categoricals. city should be one of eleven known values. When a twelfth appears, it is either a genuine launch nobody told you about, or a typo, or a trailing space that makes "Leeds " a different city from "Leeds." All three are worth knowing about before you group by it.
Outliers, investigated rather than deleted. A single order at 4,100 pounds might be a corporate catering booking or a decimal error. NIST's statistical handbook defines an outlier as an observation lying an abnormal distance from other values, offers the box plot fence rule of 1.5 times the interquartile range beyond the quartiles as a working criterion, and is explicit that outliers should be investigated because they often carry information about the process or the data-recording process itself. Deleting first and asking later throws away the alarm along with the noise.
Orphan foreign keys. Left join orders to restaurants and count rows where the restaurant record is null. Every one of those is an order that an inner join would have silently discarded. At Saffron this surfaced 1,900 orders from restaurants that had since been delisted and hard-deleted from the dimension table, which meant every "revenue by cuisine type" analysis had been quietly understating the total.
Both directions. Also check for dimension rows with no facts. A restaurant with zero orders in the period might be genuinely dormant, or might mean its orders are landing under a different identifier.
Referential checks after every transformation, not just at load. A filter applied three steps upstream can orphan rows in step four.
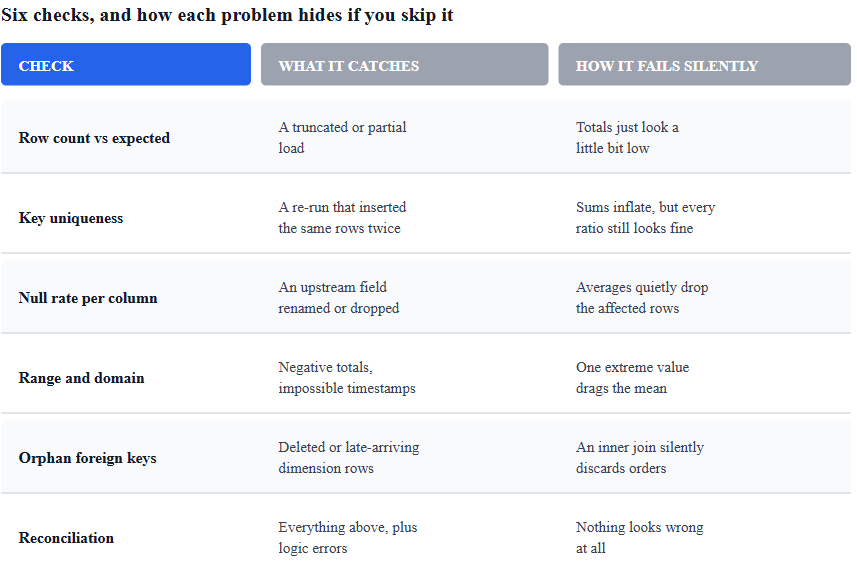
This is the check that catches everything the others missed, including your own logic errors, and it is the one analysts skip most often because it requires talking to another team.
Take one aggregate from your analysis and match it against an independently produced number. Saffron's total gross merchandise value for June, computed from orders, should match what finance reports from the payments system. If it does not, the difference is informative: a gap of exactly one day's volume points at a date filter boundary, a gap concentrated in one city points at a pipeline, and a small percentage gap spread evenly often points at duplicate or dropped rows.
Reconciliation will rarely be exact, and that is fine. What matters is that you know the size of the gap and can explain it. "We are within 0.3 percent of finance, and the difference is refunds booked in a different period" is a defensible position. "I did not check" is not.
Three places, in decreasing order of preference.
At the source. Database constraints stop bad data being written at all. Analysts rarely control this, but it is worth knowing that a NOT NULL or CHECK constraint is the strongest available version of the same rule you are about to write as a query.
In the pipeline. Automated tests that run on every refresh and fail loudly. This is the layer most worth investing in, because a check that runs once when you happen to remember it is not a check, it is a coincidence.
In your own analysis. Even with the first two in place, run your own. You know what your specific analysis assumes, and nobody else does.
Profiling tools shorten the manual version considerably. In Power Query, for instance, the column quality and column distribution panes show valid, error and empty proportions plus distinct and unique counts per column at a glance, though Microsoft's own guidance notes the default profiles only the first 1,000 rows unless you switch it to the entire dataset. That default has caused more false reassurance than almost any other setting, because a clean first thousand rows tells you very little about row 800,000.
For datasets small enough to sit in a spreadsheet, the same logic applies with different tooling, and cleaning messy data in Excel covers the practical mechanics of finding duplicates, blanks and inconsistent categories there.
Validating once at the start and never again. Data quality is not a property you establish; it degrades every time an upstream system changes. Checks belong on a schedule.
Deleting anomalies instead of investigating them. The 400 orders delivered before they were placed were a clock-change bug worth fixing, not 400 rows to drop.
Filling nulls with zero by reflex. Sometimes right, often catastrophic. A null delivery time filled with zero makes your average delivery time look excellent.
Trusting a row count as proof of success. The right number of rows containing the wrong values is the most common silent failure there is.
Checking the data but not the joins. Both tables can be individually perfect and the join between them still duplicates or drops rows.
Not writing the expectation down first. If you decide what "normal" looks like after seeing the number, you will accept almost anything as normal.
Most of these checks are three or four lines of SQL, and getting fluent enough that writing them is automatic rather than a chore is the real unlock. If the SQL side needs work, 15 real-world business SQL problems gives you queries framed around business questions rather than syntax drills, which is the same muscle validation queries use.
For running these checks in Python instead, pandas basics: DataFrames, series, indexing and filtering covers the operations that most of the above reduce to, since almost every check here is a value_counts, a duplicated, an isna sum, or a shape comparison before and after a merge.
And when you are handed a dataset you have never seen before and do not yet know what "normal" looks like, how to use AI to explore an unknown dataset covers a faster way to build that first mental model, which is what turns a generic checklist into checks that are actually specific to your data.
Quiz
Question 1 of 15
FAQ
FREE COURSES
An 11-module SQL course for data analysts preparing for interviews, built around one consistent company (Kestrel Outfitters) and one repeated method: the Five Questions What is the grain? What rows do I need? How should I combine them? How should I calculate the answer? How do I validate it? Starts with how to approach an unfamiliar SQL problem, then builds through core retrieval, aggregation, joins, subqueries and CTEs, window functions, NULL and conditional logic, reshaping and combining data, working with time, and data quality and validation finishing with a dedicated module on performance for analysts. Every lesson includes a custom diagram and a set of interview questions tagged by difficulty (Screener, Analyst, Advanced, Case) and type (Conceptual, Query Writing, Debugging, Optimization, Business Case), each with a fully worked solution. PostgreSQL-first, with dialect callouts for MySQL, SQL Server, BigQuery, and Snowflake throughout.
Most of an analyst's time goes into cleaning, not analyzing, and this course treats that seriously. Five compact modules cover the full workflow: inspecting and typing a new file, handling missing data and duplicates, standardizing text and catching invalid values, merging and reshaping multiple sources, and finally building one reusable, validated cleaning pipeline. Every lesson runs on a realistically messy dataset with genuine data quality problems built in on purpose, so what you're fixing is real, not simulated. Closes with two portfolio projects: a multi-source merge and a full reshape-and-validate pipeline.
Machine Learning for Data Analysts is a practical, hands-on course built for analysts who already know SQL, Excel, or BI tools and want to add predictive modeling to their skill set. Instead of abstract theory, every concept is taught through a single running business scenario, an online retailer named NorthPeak Outfitters, so techniques build on each other from lesson to lesson instead of feeling disconnected.