Pandas for Data Analysis
This hands-on Pandas course takes you from your first DataFrame to writing efficient, production-ready data analysis pipelines. Learn data cleaning, transformation, aggregation, merging, time series, reshaping, and performance optimization using one realistic e-commerce dataset. Build five complete portfolio projects covering sales, customer cohorts, inventory, revenue trends, and survey analysis. By the end, you'll confidently handle and analyze real-world data for data analyst and data science roles.

Rutvik Acharya
Principal Data Scientist
Atlassian
What You'll Learn
Load, clean, and inspect real-world messy data handling missing values, duplicates, and inconsistent formatting with confidence
Select, filter, and reshape data precisely using .loc, .iloc, boolean indexing, pivot tables, and MultiIndex operations
Aggregate and analyze data with groupby, merges/joins, and full time series techniques (resampling, rolling windows, datetime indexing)
Write fast, production-ready pandas code by applying vectorization, memory optimization, and method chaining best practices
Who Should Attend
Aspiring data analysts who want hands-on, job-ready pandas skills, not just theory
Excel/spreadsheet users looking to level up to programmatic, scalable data analysis
Python beginners who already know basic syntax and want to specialize in data work
Working professionals (analysts, BI developers, junior data scientists) who want to close gaps in cleaning, merging, or time series analysis
CERTIFICATION
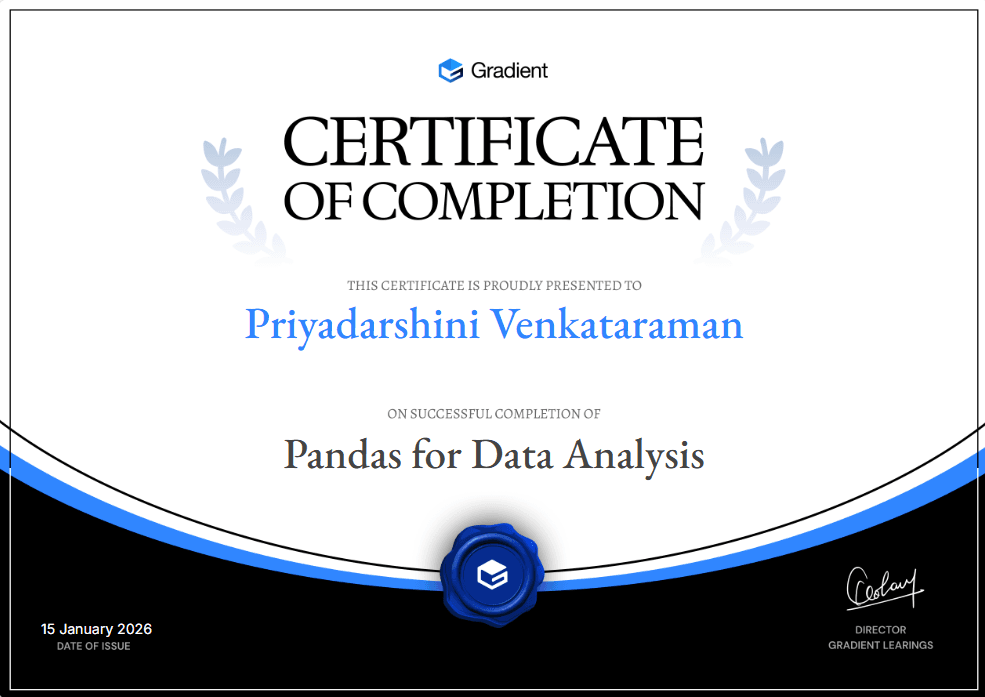
Certificate of Completion


Ready for the next step?
Data Analytics Program
Master Python, Power BI, Tableau, SQL and Excel, with AI built into every dashboard and decision.
Check it outFAQ