Funnel & Cohort Analysis for Data Analysts

You'll master funnel analysis (designing funnels, calculating drop-off, segmenting, root-cause diagnosis) and cohort/retention analysis (retention tables, heatmaps, LTV curves, churn-risk signals), all reinforced with hands-on SQL and Python. The course closes with two full portfolio projects built on real datasets: an e-commerce funnel analysis and a SaaS revenue cohort analysis.

author

Rutvik Acharya

Principal Data Scientist

Atlassian

Loading modules...

What You'll Learn

Build and interpret conversion funnels, from step design to root-cause diagnosis of drop-off

Construct retention cohort tables, heatmaps, and LTV curves to measure user and revenue retention

Write production-ready SQL (window functions, CTEs) and Python (Pandas, Matplotlib, Seaborn) for funnel and cohort analysis

Apply statistical rigor (significance testing, Simpson's Paradox) and present findings to non-technical stakeholders Who Should Attend

Who Should Attend

Data analysts who want to specialize in product or behavioral analytics

Product managers and growth marketers who need to read and question funnel/cohort dashboards

Aspiring analysts building a portfolio for data analyst or product analyst roles

SQL/Python users who know the basics and want to apply them to real business problems

CERTIFICATION

Certificate of Completion
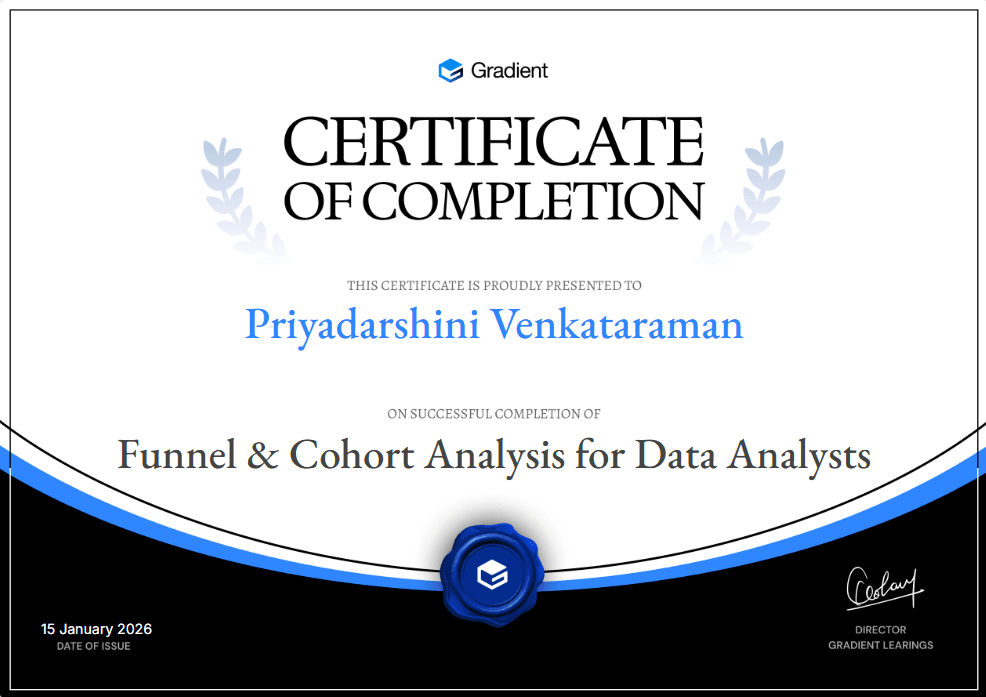
Certificate of Participation
Course
8 Modules
12 Hours 30 Minutes
30 Lessons
10 Challenges
Language: English

FAQ

FREQUENTLY ASKED QUESTIONS

You should already know the basics of SQL and Python, since the course builds on those skills rather than teaching them from scratch. No prior experience with funnel analysis, cohort analysis, or product analytics is required.
The course has 8 modules and 30 lessons. It starts with foundational concepts, moves through funnel analysis and cohort analysis in increasing depth, covers SQL and Python implementation, then statistical rigor and communication, and closes with two full portfolio projects.
The course is estimated at around 12 hours and 30 minutes, based on the lesson content plus the SQL and Python exercises and the two hands-on projects. Actual time will vary depending on your pace and prior experience.
The course uses SQL, including window functions, CTEs, and self-joins, and Python, including Pandas, Matplotlib, and Seaborn, for building and visualizing funnels and cohort tables.
There are two full end-to-end projects. The first is an e-commerce funnel and retention analysis for a business called ShopWave. The second is a SaaS trial-to-paid funnel and revenue cohort analysis for a business called CloudDesk. Both use generated datasets and include a business problem, specific questions, and a fully worked solution.
Yes. Alongside funnel analysis, the course covers building retention tables and heatmaps, calculating and reading retention curves, building revenue cohort tables, and projecting LTV curves.
Yes. One full module covers statistical significance testing for conversion rate differences, common analytical biases such as survivorship bias and Simpson's Paradox, and how to connect funnel and cohort findings to A/B testing.
Yes. The final lesson of the statistics module covers how to structure and present funnel and cohort findings to non-technical stakeholders, including leading with impact rather than methodology.
The course is designed for data analysts specializing in product or behavioral analytics, product managers and growth marketers who need to interpret funnel and cohort dashboards, and analysts building a portfolio for data analyst or product analyst roles.
The course is taught in English.
Scroll Up
GET FREE CAREER COUNSELING
Funnel & Cohort Analysis for Data Analysts | Gradient Learnings