20 AI Prompts for Data Cleaning and Exploration
The prompts that get you a diagnosis before a fix, instead of generic advice like "drop the nulls"
5 Minutes Read
Data Analytics Program — Data Analytics — Next cohort Starts Oct 24 · 35% Discount
Enroll NowThe prompts that get you a diagnosis before a fix, instead of generic advice like "drop the nulls"
Ask an AI assistant to "clean my data" and it will usually hand back a script that drops rows with missing values, removes duplicates, and calls it done. That script runs without error. It also might delete a third of a dataset where missingness meant something specific, treat two genuinely different customers as duplicates because they share a name, or standardize a column in a way that erases the exact distinction an analysis depended on. The problem isn't the AI model, it's that "clean my data" doesn't tell it what's actually wrong or why.
This article is a working set of 20 prompts for data cleaning and exploratory analysis, organized by what you're trying to accomplish: profiling a new dataset, diagnosing missing or malformed values, catching duplicates and inconsistencies, investigating outliers, and documenting the cleanup so it's repeatable. The running example throughout is trip data from a ride-hailing company called RideWave, with trip_id, rider_id, driver_id, pickup_time, dropoff_time, fare, distance_km, rating, payment_method, and city columns.
The instinct to jump straight to cleaning is understandable, but it skips the step that actually determines what the right fix is. A column with 8% missing values could mean the field is genuinely optional, a form validation bug started dropping a required field on a specific date, or a join earlier in the pipeline silently failed for a subset of rows. Each of those has a different correct fix, and none of them are visible from the missing-value count alone.
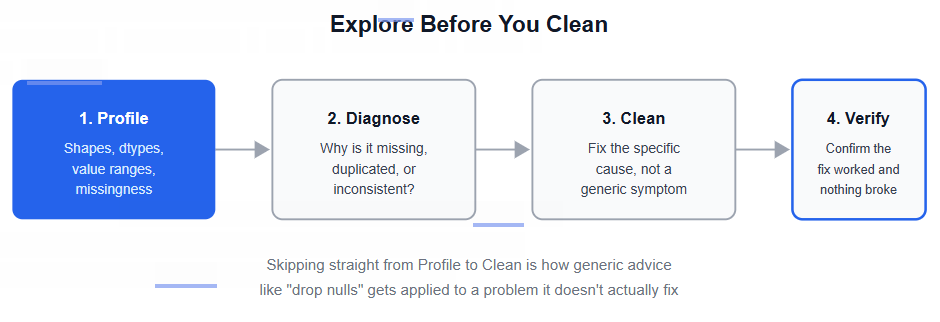
With that order in mind, here are 20 prompts organized by task.
1. The first-look profiling prompt. "Here's the output of df.info() and df.describe() for my RideWave trip data. Based on this, what should I check before doing any analysis?" Pasting the actual profiling output, not a description of the columns from memory, gives the model something concrete to reason from. Pandas' documentation for describe() describes it as producing summary statistics that vary depending on the data types present, including count, mean, standard deviation, min, max, and percentiles for numeric columns, which is exactly the kind of output worth pasting in full rather than summarizing.
2. The column-by-column guess prompt. "Based on these column names and sample values, write a data dictionary guessing what each column represents and flag any column whose purpose isn't obvious." This surfaces ambiguous columns, like a rating field that could be the rider's rating of the driver or the reverse, before they cause a misinterpreted analysis later.
3. The distribution-check prompt. "Which columns in this dataset are most worth plotting a histogram for, and why those specifically?" Rather than blindly plotting every numeric column, this prompt asks the model to reason about which distributions are likely to reveal a problem, like a fare column with a suspicious spike at exactly zero.
4. The cross-column relationship prompt. "What relationships between these columns should always hold true? For example, should dropoff_time always be after pickup_time?" This generates a checklist of logical constraints specific to your schema before you've written a single validation query.
5. The custom checklist prompt. "Generate a data quality checklist specific to this trip dataset, covering missing values, duplicates, and any impossible values given what each column represents." This turns a generic best-practices list into one tailored to a ride-hailing schema specifically, catching things a one-size-fits-all checklist would miss, like verifying whether distance_km = 0 is valid for a completed trip.
6. The missing-data diagnosis prompt. "The payment_method column is missing for about 6% of rows. Before I decide how to handle this, help me think through what could cause payment_method specifically to be missing, and how I could check which explanation is correct." Asking for causes before a fix keeps the investigation from jumping straight to imputation before understanding whether the missingness is random or systematic. It's also worth checking what actually counts as missing in the first place: pandas' documentation for isna() notes that empty strings are not treated as missing values by default, so a column can appear fully populated to isna() even when it contains empty-string values that should be treated as missing for your analysis.
7. The type coercion prompt. "The fare column loaded as text instead of numeric. Show me how to convert it, and make sure values that fail to convert are flagged rather than silently dropped." This produces code that surfaces conversion failures instead of hiding them, which matters because a silent failure here is easy to miss, since a failed conversion can produce NaN, leave the original value unchanged, or coerce to something like zero depending on the method used, any of which can flow into a downstream calculation without anyone noticing.
8. The standardization prompt. "The payment_method column has values like 'credit card', 'Credit Card', 'CC', and 'credit_card' that all mean the same thing. Write code to standardize these into one consistent value, and show me the full list of unique values first so I can check for anything I'd miss."
9. The imputation strategy prompt. "For the missing rating values, compare filling with the mean, filling with the median, and leaving them missing with a flag column. Explain the tradeoff of each approach for this specific column, not in general." Pandas' fillna() documentation shows several mechanisms, filling with a constant, a per-column value, or propagating the nearest valid observation forward or backward, and the right choice depends entirely on what the missingness means for that specific column, not a default.
10. The duplicate detection prompt. "Help me think through what should count as a duplicate trip in this dataset. Is trip_id enough, or could the same real trip appear twice under two different trip_ids?" This catches the harder category of duplicate, one that doesn't share an ID, before writing any deduplication code.
11. The cross-field consistency prompt. "Find any rows where fare is greater than zero but distance_km is zero, or where distance_km is large but fare is zero. These combinations shouldn't happen together in real trip data." This targets logical inconsistencies between columns rather than errors visible in any single column.
12. The referential check prompt. "Find any driver_id values in the trips table that don't appear in the drivers table." This surfaces orphaned foreign keys left behind by partial loads or failed deletes, a category of error a single-table check will never catch.
13. The near-duplicate prompt. "Some rider names might be entered slightly differently across trips, like a typo or an extra space. Suggest a way to detect likely near-duplicate rider records, not just exact matches." This is worth running before assuming a rider_id is a reliable unique key on its own, since manual entry systems are prone to exactly this kind of near-duplicate drift.
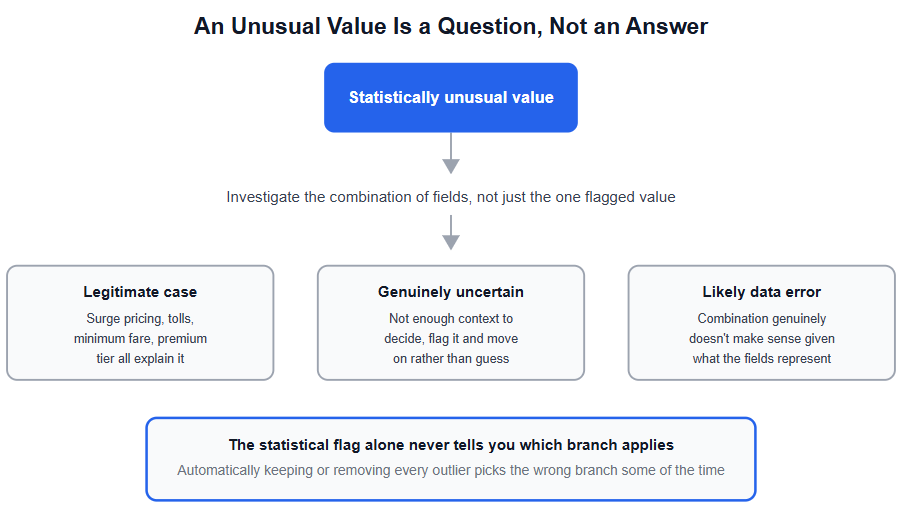
14. The outlier-versus-error prompt. "This trip has a fare of $340 and a distance of 2 kilometers. Is this more likely a legitimate outlier or a data entry error, and what would help me tell the difference?" This is the single most useful prompt in the list, since it asks the model to reason about plausibility rather than just flag the value as statistically unusual. It's also worth remembering that the final call here, keep it, fix it, or drop it, is exactly the kind of judgment that stays with the analyst rather than the model.
15. The contextual outlier prompt. "Instead of flagging outliers across the whole dataset, help me write code that flags fares that are unusual relative to other trips in the same city and similar distance range." A fare that's high citywide might be completely normal for a specific city's pricing, so this prompt asks for outliers relative to the right comparison group, not the whole dataset at once.
16. The time-based anomaly prompt. "Plot daily trip counts and help me identify any days with an unusual spike or drop, then suggest what could explain each one." This catches operational issues, like an outage or a data pipeline gap, that a column-by-column check would never surface because no single row looks wrong in isolation.
17. The reusable-function prompt. "Turn the cleaning steps we've done so far into a single function I can run on next month's export, with comments explaining what each step does and why." This is what actually makes a cleaning process repeatable instead of a one-time interactive session that has to be redone from memory next time.
18. The cleaning summary prompt. "Write a short summary of what was cleaned in this dataset: how many rows were affected by each fix, and what the reasoning was." A dataset that's been cleaned without a record of what changed is hard to trust later, especially if someone else has to pick up the analysis.
19. The before-and-after validation prompt. "Write a few assertions that check the cleaned dataset still makes sense: total row count within an expected range, no negative fares, no dropoff before pickup." This catches a cleaning script that accidentally introduced a new problem while fixing the original one, the data cleaning equivalent of a regression test.
20. The next-hypothesis prompt. "Based on everything we've found while exploring and cleaning this dataset, what are three things worth investigating further in the actual analysis?" This closes the loop, turning a cleaning session into a head start on the analysis itself instead of a separate, disconnected task, one that will likely lean back on core SQL skills once the data is warehouse-ready.
Asking to "clean the data" without specifying what's wrong. A vague request produces a generic script, drop nulls, drop duplicates, that may not match the actual problem in your specific dataset, and can delete rows or information that mattered.
Fixing missing values before understanding why they're missing. A 6% missing rate could be random, or it could be concentrated in one city, one date range, or one payment method, each of which points to a different root cause and a different correct fix.
Treating every duplicate check as an exact match problem. Real-world duplicates, especially involving names, addresses, or manually entered fields, often differ by a typo, a space, or a formatting inconsistency, and an exact-match deduplication will miss all of them.
Removing statistical outliers without checking if they're actually errors. A genuinely large fare for a long trip is a real, valuable data point. A large fare paired with a two-kilometer distance deserves investigation, it could be a legitimate case like surge pricing, a toll, a minimum fare, or a premium service tier, or it could be a genuine data-entry error. The outlier flag alone doesn't tell you which, and removing it automatically either way loses information in one direction or the other.
Cleaning interactively without saving the steps as reusable code. A cleaning process done manually in a notebook and never turned into a function has to be redone from memory next time new data arrives, and small details are easy to forget.
Skipping validation after the cleanup. A fix for one problem can silently introduce another, like a type conversion that turns unparseable values into zero instead of flagging them. Checking the cleaned data against a few basic assertions catches this before it reaches an analysis.
These prompts assume some comfort with pandas fundamentals, particularly describe(), fillna(), and basic filtering, since the prompts work best when you can read and sanity-check the code they produce rather than run it blind. If any of the profiling or type-coercion steps felt unfamiliar, the pandas basics for data analysts guide covers DataFrames, indexing, and filtering from the ground up. It's also worth treating the prompts about detecting impossible values and cross-field inconsistencies as a starting point rather than the full picture, since a dedicated pass on validation logic, once your schema's rules are clear, will catch categories of error this exploratory pass is likely to miss on a first read.
Quiz
Question 1 of 15
FAQ
FREE COURSES
Most of an analyst's time goes into cleaning, not analyzing, and this course treats that seriously. Five compact modules cover the full workflow: inspecting and typing a new file, handling missing data and duplicates, standardizing text and catching invalid values, merging and reshaping multiple sources, and finally building one reusable, validated cleaning pipeline. Every lesson runs on a realistically messy dataset with genuine data quality problems built in on purpose, so what you're fixing is real, not simulated. Closes with two portfolio projects: a multi-source merge and a full reshape-and-validate pipeline.
EDA sits between cleaned data and formal statistical testing, and this course treats it as its own real skill rather than a warm-up step. Five modules cover the EDA mindset, fast univariate and bivariate scanning, multivariate and time-based exploration, anomaly spotting, and turning an exploration session into a prioritized findings summary. Built on a full year of realistic daily business data, including genuine seasonality and two deliberately planted data quality anomalies that a later lesson finds and resolves. Closes with a cold first-look investigation on an unfamiliar dataset and a full performance deep-dive project.

This hands-on Pandas course takes you from your first DataFrame to writing efficient, production-ready data analysis pipelines. Learn data cleaning, transformation, aggregation, merging, time series, reshaping, and performance optimization using one realistic e-commerce dataset. Build five complete portfolio projects covering sales, customer cohorts, inventory, revenue trends, and survey analysis. By the end, you'll confidently handle and analyze real-world data for data analyst and data science roles.