25 Excel Formulas Every Data Analyst Uses Every Week
Grouped by the job they do, not the alphabet, with a realistic example for each
6 Minutes Read
Grouped by the job they do, not the alphabet, with a realistic example for each
Most "Excel formulas" lists are alphabetical, which is exactly backwards for learning. Alphabetical order groups AVERAGEIFS next to CONCAT for no reason other than the letter A comes before C. It tells you nothing about when you'd actually reach for either one.
This list is grouped by the job each formula does instead: cleaning messy data, looking values up across tables, aggregating numbers by condition, working with dates, and manipulating text. That's also roughly the order you'll need them in on a real dataset, since cleaning usually comes first and aggregation comes after you've got something trustworthy to summarise.

Don't try to memorise all 25 in one sitting. Read through once to see which formulas you already know cold, then bookmark this page and come back to the category you're weakest in when you actually hit that kind of problem in real data. Every formula below uses a realistic business column, Orders[Amount], Customers[Region], not a placeholder like A1:A10, because the hard part of Excel is rarely the syntax itself; it's recognising which formula the problem in front of you actually calls for.
Cleaning comes first because nothing downstream can be trusted until the raw data is. These five show up constantly on data pulled from another system, a form, or a copy-paste from somewhere with different formatting habits than yours.
# | Formula | What it's for | Example |
|---|---|---|---|
1 |
| Removes extra spaces, especially the invisible leading or trailing ones that break lookups |
|
2 |
| Strips non-printable characters that sometimes come through in exports from other systems |
|
3 |
| Replaces a specific text pattern, useful for standardising inconsistent entries like "Pvt Ltd" vs "Pvt. Ltd." |
|
4 |
| Standardises capitalisation, turning "RAHUL SHARMA" and "rahul sharma" into the same "Rahul Sharma", though it's worth a manual check afterward for brand names and names with unconventional capitalisation |
|
5 |
| Counts characters, most useful for spotting entries that are suspiciously short, blank, or truncated |
|
Where this bites people: a lookup that silently fails because the key column has trailing spaces is one of the most common sources of "why isn't this matching" in real spreadsheets. TRIM is often the first thing to check, and it's worth running defensively on any join key before trusting a VLOOKUP or XLOOKUP result.
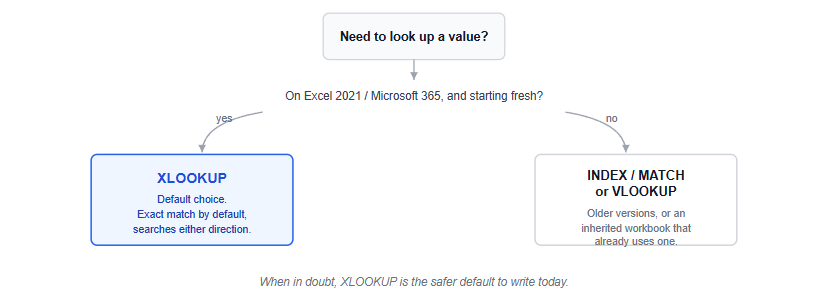
This is one of the most common areas interviewers probe, and the one where using an outdated default costs you the most credibility.
# | Formula | What it's for | Example |
|---|---|---|---|
6 |
| The modern default for pulling a value from another table based on a matching key |
|
7 |
| The older lookup function, still common in inherited workbooks and on Excel versions before 2021 |
|
8 |
| Returns a value at a given row and column position, usually paired with MATCH |
|
9 |
| Finds the position of a value in a range, rarely used alone |
|
10 |
| Replaces an |
|
Where this bites people: wrapping every lookup in IFERROR to make the red error text disappear, without ever checking why the match failed. A silently hidden #N/A is often a real data problem, a customer ID that only exists in one table, hiding in plain sight. IFNA specifically catches lookup misses rather than masking every possible error, which keeps that distinction visible.
Once the data is clean and joined, this is where a flat table turns into an answer. These five cover the vast majority of "how much, by what" questions a manager will actually ask.
# | Formula | What it's for | Example |
|---|---|---|---|
11 |
| Totals a column, filtered by one or more conditions |
|
12 |
| Counts rows matching one or more conditions |
|
13 |
| Averages a column, filtered by one or more conditions |
|
14 |
| Multiplies arrays and sums the result, useful for weighted totals or OR-style conditions SUMIFS can't express cleanly |
|
15 |
| Returns the distinct values in a range on its own; paired with COUNTA, it gives a quick count of how many different values, like customers or products, appear |
|
Where this bites people: using SUMIFS when the real question needs an OR condition across the same field, "West or North region," which SUMIFS can't express directly since its conditions are implicitly ANDed together. SUMPRODUCT fills that gap, but the logic inside it trips people up: (Region="West")*(Region="North") multiplies two conditions together, which is AND logic, and no single row can be both West and North at once, so that version always evaluates to zero. Adding the two conditions instead, (Region="West")+(Region="North"), is what expresses OR: each condition returns 1 or 0, and a row matching either one contributes a 1 to the sum. Multiplying the combined OR result by Orders[Amount] is what actually filters and totals the revenue.
Every business question has a time dimension buried in it somewhere, and dates arrive in more inconsistent formats than almost any other column type.
# | Formula | What it's for | Example |
|---|---|---|---|
16 |
| Returns the last day of a month, a specified number of months away, useful for month-end reporting boundaries |
|
17 |
| Adds or subtracts a number of months from a date, useful for renewal or expiry calculations |
|
18 |
| Calculates the difference between two dates in years, months, or days, useful for age or tenure-style calculations rather than everyday reporting |
|
19 |
| Counts business days between two dates, excluding weekends, and can optionally exclude a specified list of holidays too |
|
20 |
| Formats a date (or number) as text in a specific pattern, useful for grouping by month in a Pivot Table in a way that still sorts chronologically |
|
Where this bites people: a date column that looks like a date but is actually stored as text, usually because it was imported from a CSV. Several of the formulas in this section can fail outright or produce unexpected results when a date is stored as text rather than a genuine date value, so it's worth checking alignment, genuine dates right-align by default, before building anything on top of a suspicious date column.
The last group covers the formulas that turn raw values into business categories and handle the inevitable exceptions in real data.
# | Formula | What it's for | Example |
|---|---|---|---|
21 |
| The basic conditional, returns one value or another based on a test |
|
22 |
| Handles multiple conditions in sequence without nesting several IFs inside each other |
|
23 |
| Combines multiple text values with a chosen separator, skipping blanks automatically |
|
24 |
| Extracts a specific number of characters from the start, middle, or end of a text string |
|
25 |
| Catches any formula error and replaces it with a specified fallback value |
|
Where this bites people: reaching for a deeply nested IF when IFS would say the same thing in a fraction of the characters and be far easier for someone else, or you in six months, to actually read. Three or more nested IFs is usually the signal to switch.
Learning the syntax without the judgment call. Knowing that SUMIFS exists is not the same as knowing when a question actually needs a rate instead of a sum, or an OR condition SUMIFS can't express. The formula is the easy part.
Wrapping everything in IFERROR by default. This hides real problems, a broken join, a genuinely missing value, alongside harmless ones. Investigate the error at least once before deciding to suppress it.
Not checking whether a date column is really a date. Several of the date formulas above can misbehave, sometimes silently, when run against a text-formatted date rather than a genuine one.
Defaulting to VLOOKUP out of habit. It still works and it's still worth recognising in inherited files, but XLOOKUP avoids VLOOKUP's most common failure mode, an accidental approximate match, by default.
Nesting IFs past two or three levels. At that point IFS, or a lookup table for the categories, is almost always more readable.
This list covers formulas in isolation; seeing them inside a full cleaning and reporting workflow is a different skill, and the Excel for Data Analysis guide covers that fuller working set, including Pivot Tables and Power Query, which sit alongside these formulas rather than replacing them.
Lookups specifically come up constantly once you move into SQL, since a lookup and a JOIN are solving the same underlying problem in different tools; the SQL for Data Analysts guide is a natural next stop if XLOOKUP and INDEX/MATCH felt comfortable here. If you want to practise these formulas against a genuinely messy dataset rather than a clean example table, a few of the beginner project ideas are built around exactly that kind of cleanup work.
Quiz
Question 1 of 15
FAQ