Advanced Excel for Data Analysts

Build practical, analyst-level Excel skills from foundations to advanced analysis. Learn how to clean and structure data, write powerful formulas, use lookups and dynamic arrays, build PivotTables and interactive dashboards, transform data with Power Query, create data models with Power Pivot and DAX, automate workflows with VBA, and perform statistical and financial analysis. The course uses realistic business scenarios and hands-on projects to help you turn Excel into a powerful tool for analysis, reporting, forecasting, and decision-making.

author

Rutvik Acharya

Principal Data Scientist

Atlassian

Loading modules...

What You'll Learn

Structure and prepare messy business data for analysis.

Use XLOOKUP, INDEX-MATCH, dynamic arrays and multi-criteria lookups.

Import, clean and combine data using Power Query.

Solve complex analytical problems using LET, LAMBDA, Solver and What-If Analysis.

Who Should Attend

Data Analysts who want to strengthen their Excel skills.

Business Analysts who use Excel for reporting, analysis and decision-making.

MIS & Reporting Professionals looking to automate recurring reporting.

Students and Aspiring Analysts preparing for Excel-heavy analyst roles.

CERTIFICATION

Certificate of Completion
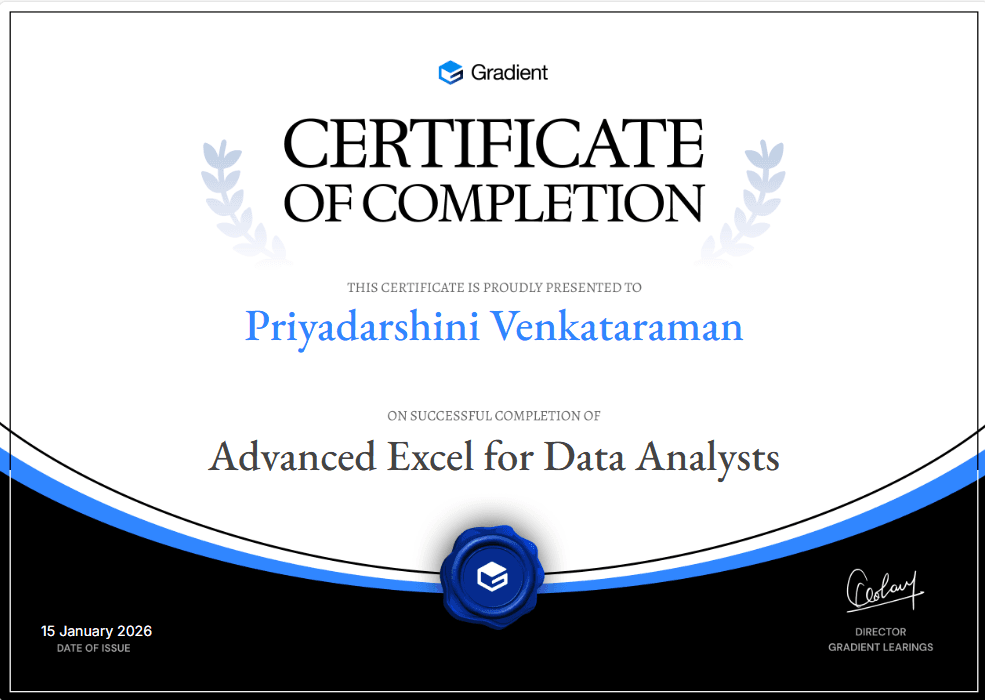
Certificate of Participation
Course
11 modules
21 Hours
55 lessons
55 Challenges
Language: English

FAQ

FREQUENTLY ASKED QUESTIONS

The course is designed for data analysts, business analysts, finance and FP&A professionals, operations and marketing analysts, reporting professionals, students, and working professionals who want to build advanced Excel skills for real-world analysis.
You will learn data cleaning, formulas and functions, lookups, PivotTables, PivotCharts, dashboards, Power Query, Power Pivot, DAX, advanced formulas, VBA automation, statistical analysis, financial analysis, and forecasting.
Basic familiarity with Excel is helpful, but the course progressively builds from Excel foundations to advanced analytical and automation techniques.
Yes. The course includes dedicated modules on Power Query for data transformation and automation, and Power Pivot with DAX for data modeling and advanced reporting.
Yes. You will learn chart selection, advanced chart techniques, KPI cards, sparklines, dashboard design principles, interactivity, and how to build a complete interactive Excel dashboard.
Yes. The automation module covers the Macro Recorder, Developer Tab, recorded VBA code, variables, loops, conditionals, repetitive reporting automation, and building a simple interactive tool.
Yes. You will learn descriptive statistics, correlation, trend analysis, forecasting, regression, and financial functions such as NPV, IRR, and PMT, along with forecast modeling.
Yes. The curriculum focuses on practical Excel skills commonly used for data preparation, analysis, reporting, visualization, automation, modeling, and business decision-making.
The course covers Microsoft Excel along with Excel Tables, PivotTables, PivotCharts, Power Query, Power Pivot, DAX, What-If Analysis, Solver, Macros, and VBA.
Yes. Learners who successfully complete the program can receive a Certificate of Completion from Gradient Learnings.
Scroll Up
GET FREE CAREER COUNSELING