Customer Retention Analysis: Metrics, SQL Queries and Business Insights
The metrics that actually matter, the SQL to compute them, and how to turn a retention number into a business decision
5 Minutes Read

Data Analytics Program — Data Analytics — Next cohort Starts Oct 24 · 35% Discount
Enroll NowThe metrics that actually matter, the SQL to compute them, and how to turn a retention number into a business decision
A retention dashboard that shows a single monthly percentage is rarely enough to act on. “Retention is 84%” does not tell anyone whether that number is good, whether it is improving, or which customer segment is dragging it down. Retention analysis becomes useful once it is broken into the right metrics, computed at the cohort level, and connected to a specific decision.
The goal of this article is to get from a raw events table to a recommendation someone can act on, using a running example: Fernway, a project-management SaaS product with a retention question from its VP of Customer Success. The same structure applies whether the product is a subscription app, a marketplace, or an internal tool being measured for renewal.
Before writing any SQL, it helps to be precise about which metric is being asked for, since “retention” gets used loosely to mean several different things.
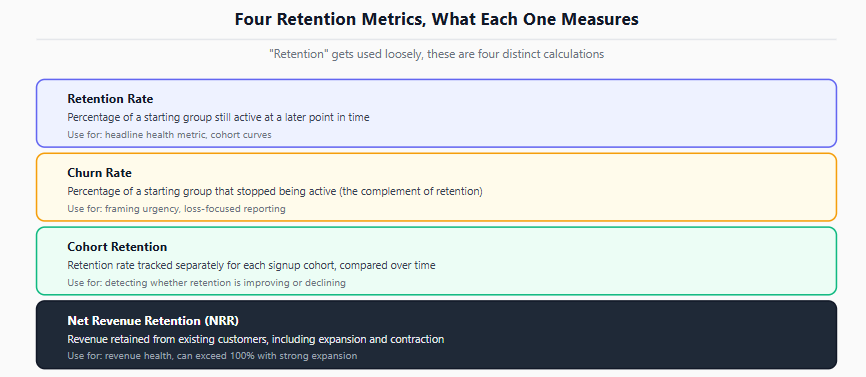
A row-by-row comparison of retention rate, churn rate, cohort retention, and net revenue retention, showing what each measures and when to use it
Metric | What it measures | Typical use |
|---|---|---|
Retention rate | Percentage of a starting group still active at a later point | Headline health metric, cohort curves |
Churn rate | Percentage of a starting group that stopped being active | The inverse framing of retention, often preferred for urgency |
Cohort retention | Retention rate tracked separately for each signup cohort over time | Detecting whether retention is improving or declining across cohorts |
Net revenue retention (NRR) | Revenue retained from an existing customer base, including expansion and contraction, expressed as a percentage | Revenue health for subscription businesses with upsell or downgrade activity |
Retention rate and churn rate are complements of each other for a fixed population and window, so reporting both is mostly a framing choice rather than two separate calculations. Cohort retention and NRR are structurally different: cohort retention tracks a customer count over time, while NRR tracks revenue and can exceed 100% if expansion revenue from existing customers outweighs the revenue lost to cancellations and downgrades.
Fernway’s VP of Customer Success wants to know: “What percentage of customers who signed up each month are still active two months later, and is that number trending up or down?” That is a cohort retention question, not a single headline percentage.
The standard approach assigns each customer to a cohort based on their signup month, then checks whether they had any activity in a later month.
-- Step 1: assign each customer to a signup cohort (PostgreSQL syntax)
WITH cohorts AS (
    SELECT
        customer_id,
        DATE_TRUNC('month', signup_date) AS cohort_month
    FROM customers
),

-- Step 2: flag activity in each subsequent month
activity AS (
    SELECT
        customer_id,
        DATE_TRUNC('month', activity_date) AS activity_month
    FROM usage_events
    GROUP BY 1, 2
)

-- Step 3: join cohorts to activity and compute months since signup
SELECT
    c.cohort_month,
    DATE_PART('month', AGE(a.activity_month, c.cohort_month)) AS months_since_signup,
    COUNT(DISTINCT a.customer_id) AS active_customers
FROM cohorts c
JOIN activity a ON a.customer_id = c.customer_id
GROUP BY 1, 2
ORDER BY 1, 2;
AGE() and DATE_PART() are PostgreSQL-specific; other engines compute a month difference differently, for example DATEDIFF(month, ...) in some warehouses or TIMESTAMPDIFF(MONTH, ...) in MySQL, so this query needs adjusting before it will run unmodified elsewhere. The PostgreSQL aggregation functions documentation covers COUNT DISTINCT and related aggregate behavior used here.
Once active customer counts exist per cohort per month, dividing each month’s active count by the cohort’s original size produces the retention percentage:
SELECT
    cohort_month,
    months_since_signup,
    active_customers,
    ROUND(
        100.0 * active_customers / FIRST_VALUE(active_customers) OVER (
            PARTITION BY cohort_month ORDER BY months_since_signup
        ),
        1
    ) AS retention_pct
FROM cohort_activity_counts;
FIRST_VALUE() here pulls the cohort’s initial size (month 0) and reuses it as the denominator for every later month in the same partition. The PostgreSQL window functions documentation covers FIRST_VALUE() and its default frame behavior if this syntax is unfamiliar.
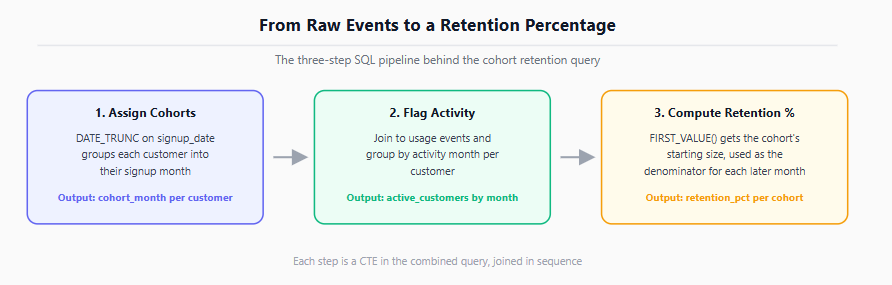
A process flow showing the three-step pipeline from raw usage events to cohort assignment to the final retention percentage calculation
Once the query above runs for several cohorts, the output is naturally read as a curve rather than a single number: retention typically drops fastest in the first month or two, then flattens into a slower decline or a plateau.
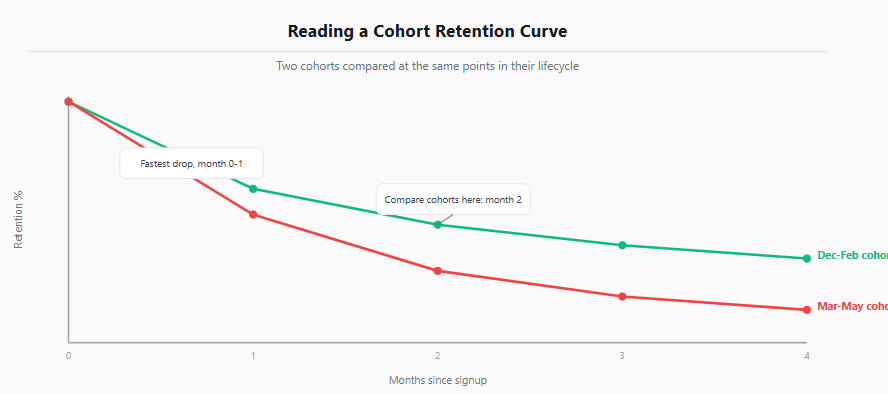
An annotated cohort retention curve showing the early drop-off, the flattening point, and how to compare two cohorts against each other
What matters for Fernway’s question is not the shape of a single cohort’s curve but whether more recent cohorts are retaining better or worse than older ones at the same point in their lifecycle. Comparing month-2 retention for the last six cohorts, rather than comparing a single month’s headline retention to last month’s, is what actually answers “is retention improving or declining.”
If cohort retention is declining, the next step is narrowing down why, which is a segmentation exercise rather than a single query. The retention drop could concentrate in a specific acquisition channel, a specific plan tier, or correlate with low product adoption in the first week.
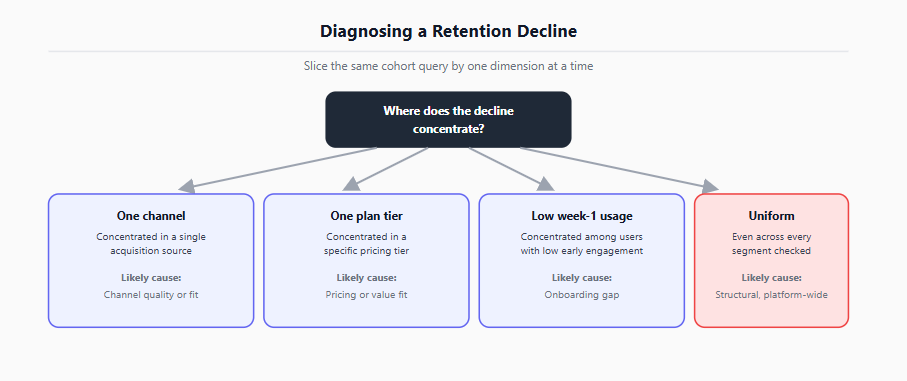
A decision flowchart for diagnosing a retention decline, routing to onboarding, pricing, channel, or product-fit causes based on where the drop concentrates
A practical approach is slicing the same cohort retention query by one dimension at a time (signup channel, plan tier, or a proxy for early engagement like “used feature X in week 1”) and checking where the decline concentrates rather than where it is uniform. A decline that is uniform across every segment points toward something structural like pricing or a platform-wide product change, while a decline concentrated in one channel or tier points toward something specific to that segment’s experience.
This diagnostic step benefits from the same discipline covered in the Gradient Learnings piece on why analytics projects fail: jumping to the first plausible explanation without checking whether it actually explains the pattern in the data is a common way retention investigations go wrong.
A validated retention finding still needs to become a decision someone can act on. The difference between a retention report and a retention insight is usually whether it names a cause and a recommended action, not just a number.
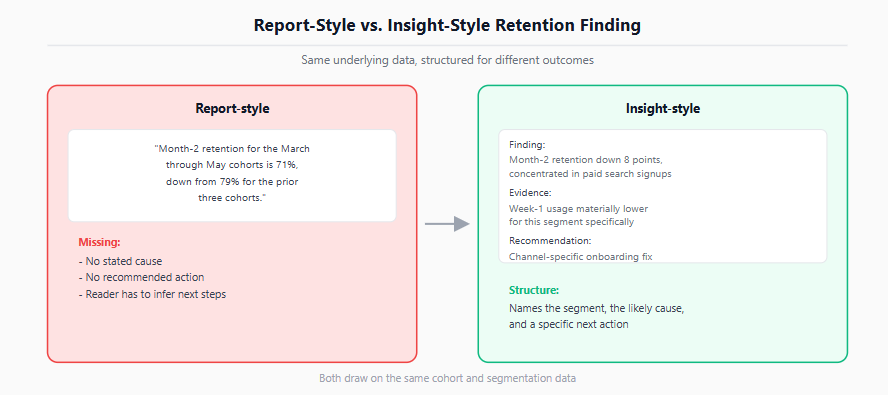
A before/after comparison of a retention report that lists numbers versus one structured around cause, evidence, and a recommended next step
A report-style version: “Month-2 retention for the March through May cohorts is 71%, down from 79% for the December through February cohorts.”
An insight-style version: “Month-2 retention has declined 8 points across the last three cohorts, concentrated almost entirely in customers who signed up through the paid search channel. Product usage in week 1 is materially lower for this segment. Recommendation: prioritize a channel-specific onboarding flow for paid search signups before adjusting acquisition spend.”
Framing a finding around what caused it and what to do about it is what allows a retention analysis to inform a decision rather than being read once and filed away, a distinction covered in more general terms in the Gradient Learnings guide on presenting difficult findings to senior leaders. For subscription businesses tracking revenue rather than customer counts, the same before/after and channel-slicing logic applies to net revenue retention, with the added step of separating churned revenue from downgrade revenue so the recommendation targets the right lever. Tying a recommendation to a specific, testable cause rather than a general trend is a pattern Harvard Business Review has covered repeatedly across analytics case studies, and it is generally what determines whether a finding gets acted on or filed away.
Reporting a single retention percentage instead of a cohort curve. A single number cannot show whether retention is improving or declining over time.
Comparing this month’s retention to last month’s headline number instead of comparing the same cohort age (for example, month 2) across multiple cohorts, which controls for how long each cohort has had to churn.
Treating retention rate and churn rate as if they need separate root-cause investigations. For a fixed population and window, they are complements of the same underlying number.
Confusing customer-count retention with net revenue retention. A stable customer count can mask declining revenue per customer, and NRR above 100% can mask a shrinking customer base offset by expansion revenue from the customers who remain.
Assuming the first plausible explanation for a decline is the cause without slicing by channel, tier, or engagement to check where the decline actually concentrates.
Using unadjusted date arithmetic across SQL engines. Functions like AGE(), DATE_PART(), and DATEDIFF() are not interchangeable across PostgreSQL, MySQL, and other warehouses.
This article assumes basic comfort with SQL joins, aggregation, and window functions. If any of those are shaky, SQL for data analysts: essential skills is the right starting point before returning to cohort queries. For retention problems that are step-based rather than time-based, for example measuring where users drop off inside an onboarding flow rather than month over month, see funnel analysis: finding where customers drop off. If the next step is presenting a retention finding in an interview setting, how to explain a data analyst project in an interview covers how to narrate this kind of investigation concisely.
Quiz
Question 1 of 15
FAQ