Business Intelligence & KPI Analysis for Data Analysts

A hands-on course that takes you from BI foundations to KPI design, SQL calculation, dashboards, data quality, experiments, and clear communication of insights. Every lesson uses worked examples, exercises, and interview questions. The description is two sentences. If you want it shorter, use: "Learn to design, calculate, analyze, and present KPIs, from BI foundations to dashboards, data quality, and experiments."

author

Rutvik Acharya

Principal Data Scientist

Atlassian

Loading modules...

What You'll Learn

Define and design KPIs that tie directly to business decisions.

Calculate revenue, customer, marketing, and subscription KPIs with SQL.

Build clear dashboards and charts that show the right message.

Test ideas with experiments, forecasts, and sound data quality checks.

Who Should Attend

Aspiring and junior data analysts.

BI developers who want stronger KPI and analysis skills.

Business analysts who report on performance.

Anyone who knows basic SQL and wants to turn data into decisions.

CERTIFICATION

Certificate of Completion
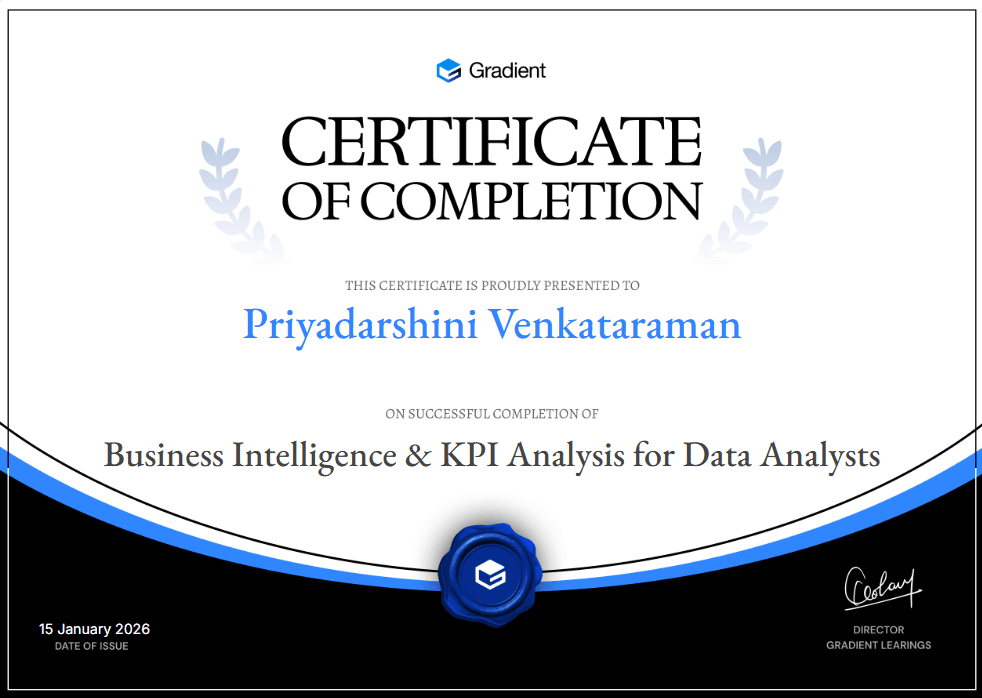
Certificate of Participation
Course
13 Modules
20 Hours
94 Lessons
94 Challenges
Language: English

FAQ

FREQUENTLY ASKED QUESTIONS

No prior business intelligence experience is needed. The course starts with what BI is and builds up from there. Basic familiarity with SQL helps in the calculation modules, which begin with aggregation and grouping.
It is designed for aspiring and junior data analysts, BI developers, and business analysts who report on performance. It also suits anyone who wants to turn data into clear decisions.
You will learn to define and design KPIs, calculate them with SQL, and compare them over time. You will also learn to diagnose changes, design dashboards, check data quality, run experiments, and present your findings clearly.
Yes. This is a free course, and all 13 modules are included.
The course has 13 modules and 94 lessons. Each lesson includes worked examples, a practice exercise, interview questions, and key takeaways, and every module ends with a summary and an answer key.
Reading the whole course takes roughly 20 hours. Add time for the practice exercises, which depends on how much you work through on your own.
The SQL examples are written for PostgreSQL, so having a PostgreSQL database to practice on is helpful. Some later lessons, such as experiments and forecasting, use short Python scripts with numpy, pandas, and scipy.
No. The examples use invented data from a fictional retailer called Meridian Goods, and the capstone uses a fictional coffee subscription business. Because the data is made up, you can safely share your practice work, and the lessons can show how each method behaves.
Every lesson ends with interview questions that describe what a strong answer looks for, so you can practice explaining the ideas out loud. The course does not promise a job, but it gives you plenty of material to rehearse with.
The final module applies the methods from the earlier modules to one new project. You choose and scope a question, build and check the data, analyze it, and finish with a decision and a plan for a follow-up test.
Scroll Up
GET FREE CAREER COUNSELING