A/B Testing: How Data Analysts Actually Evaluate an Experiment
The checklist that matters more than the formula: what to get right before, during, and after the test
5 Minutes Read
Data Analytics Program — Data Analytics — Next cohort Starts Oct 24 · 35% Discount
Enroll NowThe checklist that matters more than the formula: what to get right before, during, and after the test
Ask someone what A/B testing involves and you'll usually hear some version of "run the test, check if p is less than 0.05." That's the smallest part of the actual skill. Most of what separates a trustworthy experiment from a misleading one happens before the p-value is ever calculated, in decisions made while designing the test, and in checks run while it's still live, not in the final formula.
This guide is built around that reality: a checklist for what to get right at each stage, before the test starts, while it's running, and once it's time to read the result, including the specific ways experiments quietly go wrong that a pure statistics explanation usually skips. It builds directly on the hypothesis-testing concepts covered in this site's statistics guide, linked at the end; this piece is about applying those concepts to a real, running experiment rather than a static dataset.
The running example: an e-commerce checkout page test, comparing the current "Buy Now" button colour against a new variant, with conversion rate as the primary metric.

Define the primary metric before the test starts, not after. For the checkout test, that's conversion rate, specifically, and deciding this in advance matters more than it sounds like it should. Choosing the metric after seeing the data invites picking whichever metric happened to move, which isn't a test result, it's a story built backwards from noise.
Decide the minimum detectable effect (MDE) before running the test. This is the smallest change in conversion rate worth caring about, a 0.5 percentage-point increase in conversion might be worth detecting, while a smaller change might not justify the engineering cost. The MDE is one of the key inputs to the sample-size calculation. Along with the baseline conversion rate, significance level (alpha), desired statistical power, and traffic allocation, it determines how much data the test needs. A smaller MDE requires more data to detect reliably because smaller effects are harder to distinguish from normal variation.
Sample size should be planned before the experiment starts rather than decided by intuition once the test is live. The calculation typically depends on the baseline conversion rate, the minimum detectable effect, the significance level (alpha), the desired statistical power, and how traffic is allocated between variants.
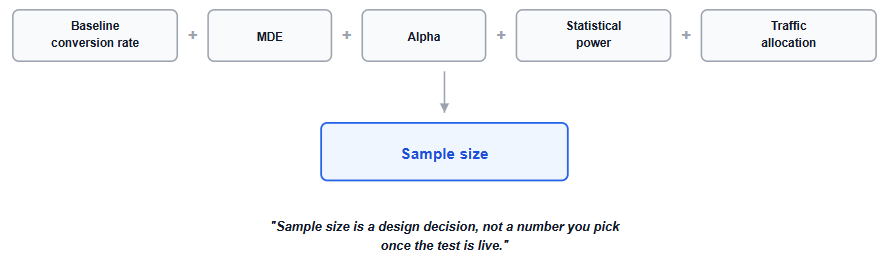
The key practical point is that "we have enough users now" is not a statistical stopping rule. A pre-defined sample-size plan gives the team a clear point at which the planned analysis can be performed without repeatedly checking the result and deciding when to stop.
Choose the randomization unit deliberately. For a checkout button test, randomizing at the individual-user level is usually the safest choice, rather than randomizing by session or page view. Randomizing by session risks the same user seeing both button colours across different visits, contaminating the comparison; randomizing by user keeps each person consistently in one group for the whole test.
Consider novelty and primacy effects when interpreting early results. Users may respond differently to a change simply because it is new, not because it is genuinely better. A new button colour might see an initial lift purely from standing out, or an initial dip while returning users get used to it, either of which can fade as the novelty wears off. This is one more reason a result checked too early can be misleading even before peeking or sample size are considered.
These two problems are the actual differentiator in this guide, since they rarely get the attention the final significance calculation gets, despite being more common causes of a misleading result.
Peeking, checking significance repeatedly and stopping as soon as it's reached, inflates the false positive rate far more than most people expect. A test designed to run for two weeks, checked daily with a decision to stop the moment p < 0.05 first appears, isn't actually testing at the 5% significance level anymore. Each additional look is another chance for noise to cross the threshold by pure luck, and stopping at the first lucky crossing means the real false positive rate across the whole test can climb well above 5%, sometimes considerably above it. The fix is deciding the sample size and stop date in advance and holding to it, or using a testing method specifically built to allow legitimate early stopping, which standard significance testing isn't.

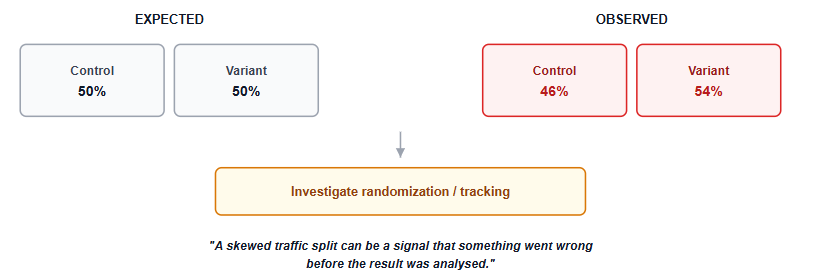
Sample ratio mismatch (SRM) is a check almost nobody runs, and it should be one of the first things checked once a test is live. If the test is meant to split traffic 50/50, the actual observed split should be close to that, not exactly 50/50, but close. A split such as 46/54 can be a warning sign, particularly once the sample is large enough that random variation is unlikely to explain the difference, pointing to something wrong with the randomization or the tracking itself, a bug in the assignment logic, a caching issue affecting one variant differently, a tracking pixel that fires inconsistently. An SRM doesn't just weaken the result, it can invalidate it entirely, since the two groups may no longer be comparable in ways that have nothing to do with the button colour being tested.
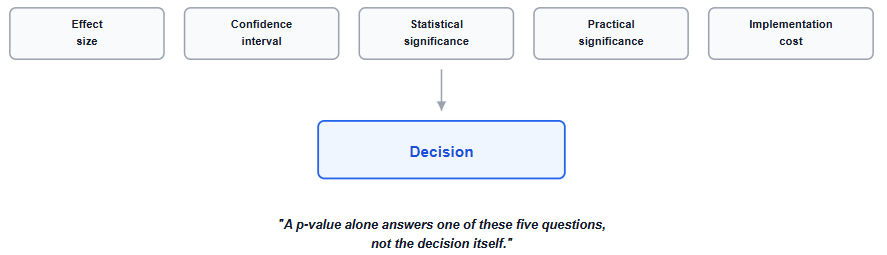
Statistical significance and practical significance are different questions, and both need answering. A result can be statistically significant, genuinely unlikely to be pure noise, while still being too small a lift to justify the engineering cost of shipping it. The statistics guide's coverage of hypothesis testing, linked below, goes deeper into this distinction; the short version here is that "significant" answers whether something happened, not whether it's worth acting on.
Look at the effect size and confidence interval, not just the p-value. A p-value can help answer how surprising the observed result would be under the null hypothesis, but it does not tell you how large the effect is or how precisely it has been estimated. A confidence interval gives a useful range of plausible effect sizes and helps you judge whether the result is both statistically credible and practically meaningful.
Example: if the estimated lift is +3% with a 95% confidence interval of +0.5% to +5.5%, the result suggests a positive effect, but the range tells you the true effect could be much smaller than the headline estimate. That matters when deciding whether the improvement is large enough to justify shipping.
Watch for the multiple comparisons trap. Testing conversion rate, average order value, time on page, and five other metrics, then reporting whichever one came back significant, inflates the real false positive rate the same way peeking does, just applied across metrics instead of across time. If several metrics are genuinely worth tracking, decide the primary metric in advance and treat the rest as secondary, interpreted with appropriately more caution, not as equally valid candidates for the headline result.
The same trap applies to segments. Slicing the result by device, region, browser, and user tenure until one segment shows significance is the segment-level version of the same problem; with enough slices, something will look significant by chance alone. A segment finding from an experiment not designed to test that segment specifically is a hypothesis worth testing properly next, not a conclusion to act on immediately.
Choosing the metric after seeing early results. Decide the primary metric before the test starts, or the "result" is really just a story fit to whatever moved.
Skipping the sample ratio mismatch check. It's one of the fastest checks to run and one of the most commonly skipped, despite being able to invalidate an otherwise clean-looking result.
Stopping the test the moment significance first appears. Peeking without a correction for repeated looks inflates the real false positive rate well above the stated significance level.
Randomizing by session instead of by user. This lets the same person land in both groups across different visits, contaminating the comparison for a metric like a button colour test.
Treating every tracked metric as an equally valid headline result. Decide the primary metric in advance; treat everything else as secondary and interpret it more cautiously.
Slicing by segment until one shows significance. A segment result from a test not designed to detect it is a new hypothesis to test properly, not a finished conclusion.
Drawing conclusions from the first few days of a test. Early results can be skewed by novelty or primacy effects, users reacting to a change simply because it's new, not because it's genuinely better, and letting the test run its planned duration helps that effect settle out.
This guide assumes comfort with the underlying hypothesis-testing concepts, p-values, confidence intervals, what statistical significance actually means; the Statistics for Data Analysts guide covers that foundation in depth if any of it felt unfamiliar here.
For practising this end to end, several of the beginner project ideas are a reasonable fit for simulating an A/B test analysis on a public dataset, and A/B testing questions come up frequently enough in analyst interviews that the interview questions guide is worth reviewing alongside this piece.
Quiz
Question 1 of 18
FAQ
FREE COURSES
A/B testing is one of the highest-leverage skills a data analyst can have: it's the difference between telling a company what happened and telling them what to do next. This course takes you from the foundations of experimentation through statistics, hypothesis testing, and experiment design, into the core statistical tests analysts use daily, honest result interpretation, and advanced pitfalls like Simpson's Paradox and multiple testing. You'll close with hands-on SQL and Python workflows and two full portfolio projects, so you finish with real work to show, not just notes.
A statistics course built for working Data Analysts, not a general statistics degree. Every lesson passes one test: would a working analyst actually use this on the job. Four modules take you from descriptive statistics and probability through hypothesis testing to regression, all taught on one continuous fictional retailer's data so techniques build on data you already recognize. Closes with two full end-to-end portfolio projects, each ending in a written business recommendation. No unnecessary mathematical depth, no career filler, every number in every lesson verified against real data before it's written down.
A 12-module, hands-on course that teaches product analytics using one real, consistent dataset from start to finish, SQL, funnels, retention, A/B testing, segmentation, churn modeling, and stakeholder communication. Every number is computed and verified, not invented. Ends with two full portfolio projects you can show off.