Power BI DAX for Data Analysts

A hands-on path to real DAX fluency in Power BI, from data modeling fundamentals through CALCULATE, time intelligence, iterators, and advanced analytical patterns, all built on one retail model you construct yourself. Closes with two full portfolio projects: a retail sales dashboard and a SaaS analytics build.

author

Rutvik Acharya

Principal Data Scientist

Atlassian

Loading modules...

What You'll Learn

Build a proper star schema data model and understand why it's the foundation of every DAX calculation

Master CALCULATE, row context, and filter context, the concepts behind almost every real-world measure

Write time intelligence, iterator, and table function formulas with confidence, not copy-pasted templates

Build two full portfolio projects: a retail sales dashboard and a SaaS subscription analytics model

Who Should Attend

Data analysts who use Power BI but want to move beyond basic formulas

BI developers looking to deepen their DAX fundamentals

Excel power users transitioning into Power BI and data modeling

Anyone preparing for a data analyst role that requires strong DAX skills

CERTIFICATION

Certificate of Completion
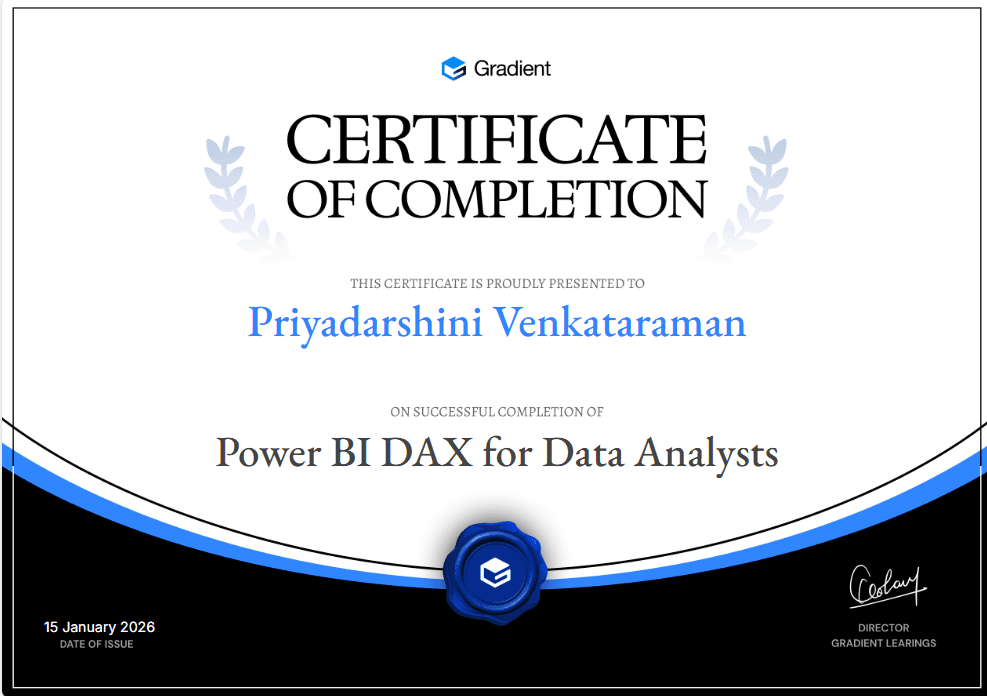
Certificate of Participation
Course
12 Modules
18 Hour 20 Minutes
55 Lessons
55 Challenges
Language: English

FAQ

FREQUENTLY ASKED QUESTIONS

This course is built for data analysts who already use Power BI but want to move beyond basic formulas, as well as BI developers looking to deepen their DAX fundamentals and Excel power users transitioning into Power BI and data modeling. It starts from data modeling foundations and builds up through DAX syntax, context, and advanced patterns, so you do not need prior DAX experience, but some familiarity with Power BI itself is expected.
Yes, this is a free course.
You will learn how to build a proper star schema data model and understand why it is the foundation of every DAX calculation, master CALCULATE, row context, and filter context, and write time intelligence, iterator, and table function formulas with confidence rather than relying on copy-pasted templates. The course concludes with two full portfolio projects covering a retail sales dashboard and a SaaS subscription analytics model.
The course runs about 18 hours and 36 minutes across 12 modules and 55 lessons.
The course is in English.
Yes. Every lesson includes a practice exercise with a worked answer, along with sample interview questions and key takeaways, so you are applying each concept as you go rather than only reading about it.
Yes. The final module includes two complete, end-to-end portfolio projects: a multi-store, multi-year retail sales performance dashboard covering growth, year-over-year comparisons, top products, and regional performance, and a subscription and SaaS revenue analytics project covering MRR, churn, cohort retention, and customer lifetime value.
This course is meant for data analysts who use Power BI but want to move past basic formulas, BI developers looking to strengthen their DAX fundamentals, Excel power users moving into Power BI and data modeling, and anyone preparing for a data analyst role that requires strong DAX skills.
The course covers data modeling foundations, DAX syntax, row context, filter context, CALCULATE, variables, time intelligence, iterator functions, table functions and advanced filtering, advanced DAX patterns such as cohort analysis and ABC classification, and performance, debugging, and best practices, before finishing with the two portfolio projects.
The retail sales dashboard project extends the same retail data model built and used throughout the course to a full multi-year, multi-store dataset. The SaaS revenue analytics project intentionally uses a different data model, built around subscription events rather than retail transactions, so you can practice applying the same DAX skills to a new business context.
Scroll Up
GET FREE CAREER COUNSELING
Power BI DAX for Data Analysts | Gradient Learnings