Excel for Business Analytics
This complete Excel course takes you from beginner fundamentals to advanced business analytics and modeling. Learn formulas, lookups, data cleaning, Power Query, PivotTables, dashboards, dynamic arrays, financial modeling, and automation. Work with one realistic retail dataset throughout the course so every skill builds naturally. By the end, you'll be able to turn messy data into reliable analysis, interactive dashboards, and practical business models.

Rutvik Acharya
Principal Data Scientist
Atlassian
What You'll Learn
Build fast, reliable formulas lookups (VLOOKUP, INDEX/MATCH, XLOOKUP), conditional logic, and dynamic arrays without breaking when data changes
Clean messy real-world data and automate recurring reports with Power Query
Build interactive PivotTable dashboards with slicers, timelines, and presentation-ready charts
Construct full business models with financial functions, sensitivity analysis, and a properly structured Inputs → Calculations → Output design
Who Should Attend
Beginners who want a structured, ground-up path into Excel and business analytics no prior experience required
Business, operations, marketing, or HR professionals who want to move beyond basic spreadsheets into real analysis
Anyone who knows basic Excel but wants to level up to PivotTables, Power Query, dashboards, and financial modeling
Aspiring business or financial analysts building a strong technical foundation in Excel
CERTIFICATION
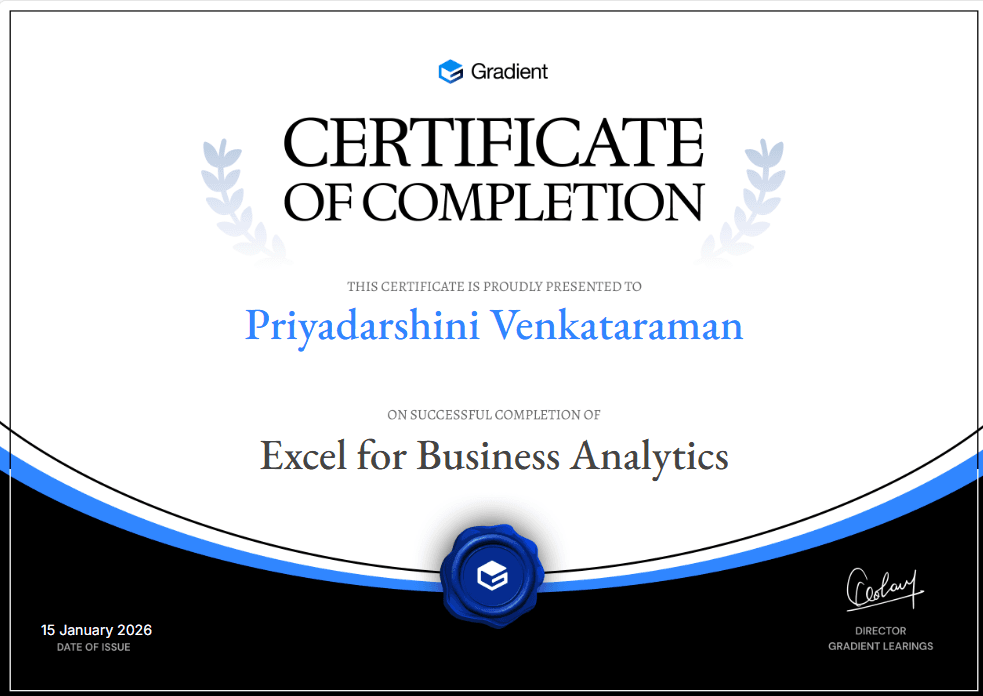
Certificate of Completion


Ready for the next step?
Data Analytics Program
Master Python, Power BI, Tableau, SQL and Excel, with AI built into every dashboard and decision.
Check it outFAQ