Claude for Data Analysts

Most guides to AI tools teach you how to get an answer. This course teaches you how to get an answer you can put your name on. Across 11 modules you will cover the full arc of an analyst's job Every lesson uses one fictional company, so the same figures follow you from the first module to the last. Each includes practical examples, common mistakes, practice exercises, interview questions, and downloadable diagrams. For working analysts and people moving into analytics. No AI experience assumed.

author

Rutvik Acharya

Principal Data Scientist

Atlassian

Loading modules...

What You'll Learn

Tell the difference between a number Claude computed and one it predicted, and make sure every figure you report is the first kind

Catch the errors that never raise an error: wrong grain, fan-out joins, mix effects, and correlation read as cause

Turn recurring analysis into Projects and Skills so your definitions stop drifting between periods

Ship findings with their exclusions, caveats and accuracy stated before anyone asks

Who Should Attend

Working data analysts who want to move faster without loosening their standards

Business, marketing and finance professionals who own numbers other people act on

Career changers moving into analytics who want to learn the judgement, not just the tools

Aspiring Data analysts

CERTIFICATION

Certificate of Completion
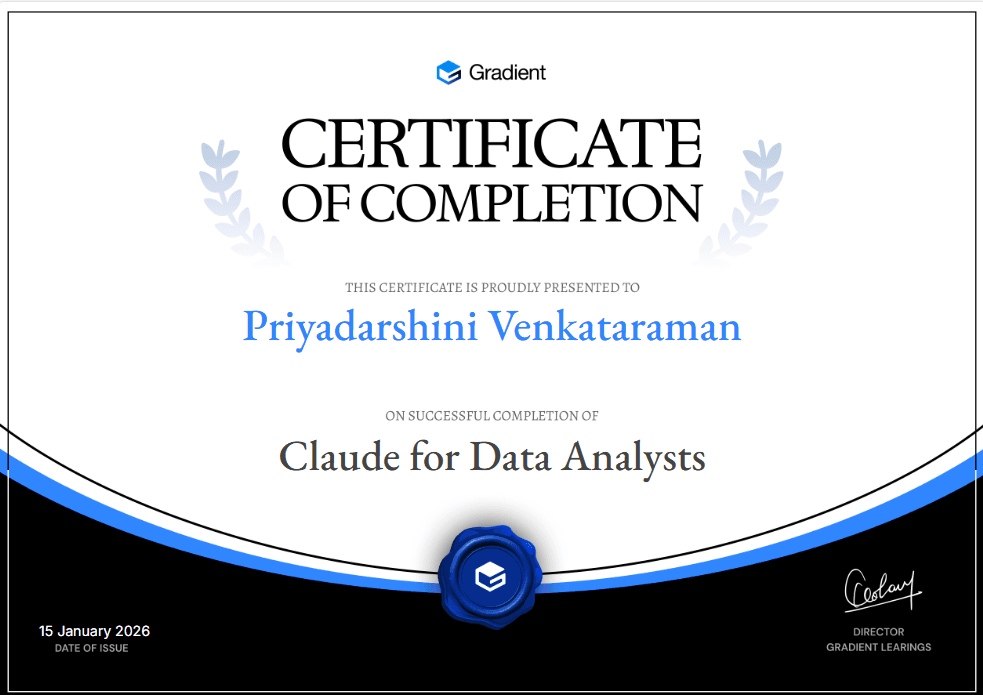
Certificate of Participation
Course
11 Modules
14 Hours 45 Minutes
59 Lessons
59 Challenges
Language: English

FAQ

FREQUENTLY ASKED QUESTIONS

No. The course starts by establishing what Claude actually does when it touches your data, including the distinction between predicting a number and computing one, which is the single most important thing to understand and the one most self-taught users never learn. If you have used AI tools casually for writing, that is a fine starting point.
Familiarity with spreadsheets is enough to begin. Basic SQL and comfort reading Python will help you move faster in Modules 5, 9 and 10, but every code example is explained line by line and nothing assumes you could have written it yourself. What the course does assume is that you understand the analytical work itself: what a metric is, why a definition matters, what a stakeholder wants from a number.
Most of the course works on any plan, since code execution and file creation are available across plans. A few surfaces covered in Modules 8 and 10 require a paid plan, and the API modules are billed separately from a subscription. Each module notes plan requirements where they apply, with sources and access dates, since these change.
No. Every example shows the data it uses, so the course reads completely without any files. If you want hands-on practice, Module 1 shows you how to generate your own version of the course dataset, which is itself a useful exercise. Practice exercises are also written so you can run most of them against data you already work with.
A fictional direct-to-consumer outdoor gear retailer built specifically for this course, with orders, customers, products and marketing data. It runs through all eleven modules with internally consistent figures, so complexity builds instead of restarting with a new toy dataset every lesson. You get to know its quirks the way you get to know a real employer's data, which is slowly and by being wrong about it a few times.
Only partly. Module 3 covers prompting properly, but the argument of the course is that clever phrasing is not where the value sits. The analysts who do well with these tools are the ones who define their own metrics, ask for evidence before interpretation, and check the second thing. Roughly two thirds of the material is analytical judgement rather than tool technique.
The tool specifics will move, and the course is built with that in mind. Every product fact is sourced with an access date and a note to re-check it, and Module 2 makes re-verification an explicit habit rather than an afterthought. The analytical content, which is the bulk of it, does not depend on any particular product version.
The course takes that seriously rather than working around it. Module 2 covers what must never be uploaded and how to automate column minimisation, Module 9 covers what has to be true before an assistant touches production data, and Module 11 gives you a one-page team standard you can adapt. Several learners will find the governance material is what lets them get approval in the first place.
Around fifteen hours in total, at roughly fifteen minutes per lesson including the practice exercise. The modules are sequential by design, since the dataset and the concepts compound, but Modules 8 through 11 can be read on their own if you have a specific need. Starting at Module 9 without Modules 1 to 5 will leave gaps, because the SQL work assumes you know what fan-out is and why grain matters.
Take a messy file or a warehouse table, establish what it really contains, compute figures that reproduce to the cent, notice when a correct number supports a wrong conclusion, produce a deliverable someone acts on, turn recurring work into something a colleague can run, and defend every figure you publish. The course closes the same question it opens with, tracing one margin analysis from an unopened file to an audited, reproducible number.
Scroll Up
GET FREE CAREER COUNSELING