Advanced Power BI Dashboard Design
Learn to design Power BI dashboards that turn business data into clear decisions. Across eight modules, develop skills in dashboard planning, layout, accessibility, data modelling, DAX measures, visual storytelling, and interactive analysis. Build slicers, drill-through pages, tooltips, field parameters, and bookmarks. Learn to diagnose performance issues, validate calculations, create mobile layouts, configure row-level security, and plan publishing and maintenance.

Rutvik Acharya
Principal Data Scientist
Atlassian
What You'll Learn
Design clear dashboard layouts with effective visual hierarchy, accessible formatting, and business-focused storytelling.
Build reliable data models and DAX measures for targets, variances, attainment, and time comparisons.
Create guided analysis using slicers, drill-through, tooltips, field parameters, and bookmarks.
Optimise performance, validate results, configure access controls, and complete two portfolio dashboard projects.
Who Should Attend
Data analysts who want to improve the clarity, usability, and business impact of their Power BI reports.
Power BI users familiar with basic visuals, relationships, and simple DAX measures.
Business analysts and reporting professionals building dashboards for stakeholders and leadership teams.
Learners developing a portfolio through practical sales, customer retention, and profitability projects.
CERTIFICATION
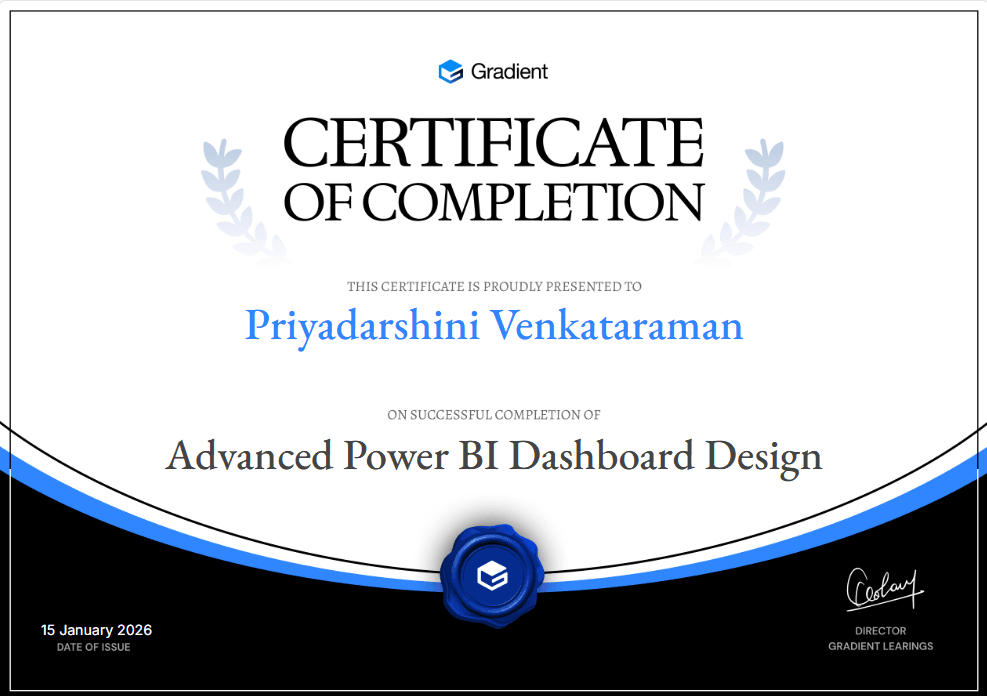
Certificate of Completion


Ready for the next step?
Data Analytics Program
Master Python, Power BI, Tableau, SQL and Excel, with AI built into every dashboard and decision.
Check it outExplore Gradient Data Analytics Program and unlock a world of benefits
Structured Curriculum
Experience expert-led learning with our industry-proven curriculum
1:1 Mentorship Sessions
Learn from industry experts with our personalised 1:1 Mentorship
Career Support
We're dedicated to helping you achieve your career goals
FAQ