How to Validate Data Before Analysis: 15 Data Quality Checks Every Analyst Needs
Fifteen checks in the order they should run, and what to do when one of them fails
5 Minutes Read
Data Analytics Program — Data Analytics — Next cohort Starts Oct 24 · 35% Discount
Enroll NowFifteen checks in the order they should run, and what to do when one of them fails
The expensive version of a data quality problem is not the one that breaks the query. It is the one that returns a plausible number. A join that quietly duplicates rows inflates revenue by a believable margin, the chart looks normal, and the error surfaces three weeks later when finance reconciles.
Validation is the work that catches those before they reach a slide. It is also the work most often skipped, because a dataset that loads without error feels like a dataset that is ready.
Two things make validation tractable. The checks are ordered, since a failure at one level makes results at the next level meaningless. And each check has a defined response, because "the data is bad" is not an outcome anyone can act on. What follows is fifteen checks grouped into five gates, in the sequence they should run, with a triage framework for the failures.
The running example is a daily orders table joined to a customers table, feeding a revenue report.
Running checks in the wrong order wastes time investigating symptoms of a problem you have not found yet.
If the grain of your table is wrong, every distribution you examine afterwards is a distribution of duplicated rows. If the load truncated at a system limit, the missing-region check will report missing regions that exist fine in the source. Each gate below assumes the ones before it passed.
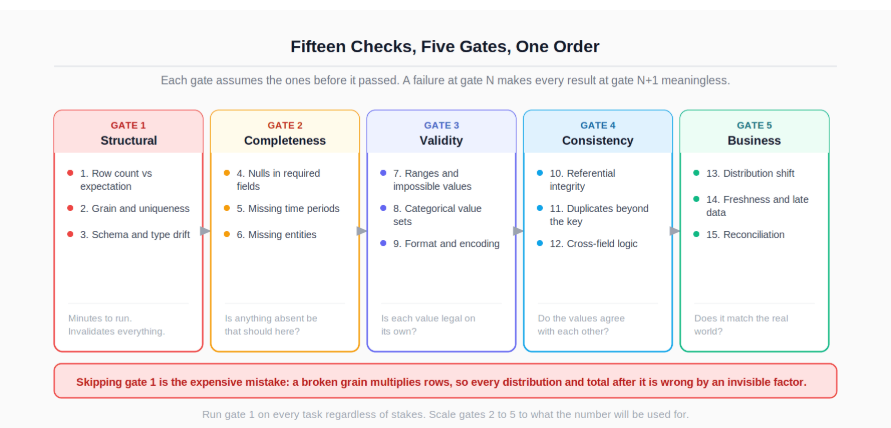
The gates also map to how you spend time. The structural checks take minutes and catch the errors that invalidate everything. The business checks take longest and are worth running only once the foundation is sound.
Compare the row count to the trailing pattern and to the source system, not to zero. A daily orders load that usually lands within a familiar band and today arrives at half that size is a pipeline problem, not a business collapse.
Pay particular attention to counts that land on a suspiciously round number. A result sitting exactly at a system boundary is almost always truncation rather than coincidence: an API default page size, a query row limit, or Excel's documented worksheet row limit reached during an export. The fix is to re-extract with pagination, not to analyse what arrived.
Every table has an intended grain, and the analysis is only valid if the data actually holds it. State the grain in words first ("one row per order"), then test it.
-- Does the table hold its stated grain?
SELECT order_id, count(*) AS n
FROM orders
GROUP BY order_id
HAVING count(*) > 1
ORDER BY n DESC
LIMIT 20;
For composite grains, group by the full key. This check is the single highest-value item on the list, because a broken grain silently multiplies every downstream sum. Run it again on the result of every join you write, not just on source tables.
Confirm the columns you expect exist, and that they hold the types you expect. Numeric columns arriving as text are common when data passes through a CSV or a spreadsheet, and they sort incorrectly and aggregate not at all. Identifier columns are the reverse problem: an ID read as a number loses leading zeros permanently.
# Check the contract before analysing anything.
print(df.dtypes)

expected = {"order_id": "object", "order_total": "float64", "order_ts": "datetime64[ns]"}
for col, want in expected.items():
    got = str(df[col].dtype) if col in df else "MISSING"
    if got != want:
        print(f"{col}: expected {want}, got {got}")
An object dtype on a column you believe is numeric means at least one value did not parse, and the pandas guide to dtypes explains why mixed content falls back to that type. Read IDs as strings deliberately at load time rather than repairing them afterwards.
Distinguish columns where null is legitimate (a discount code) from columns where it is a defect (a customer ID on an order). Only the second group is a finding.
-- One pass over the table. count(col) ignores NULLs; count(*) does not.
SELECT
    count(*)                     AS rows_total,
    count(*) - count(customer_id) AS null_customer_id,
    count(*) - count(order_total) AS null_order_total,
    count(*) - count(order_ts)    AS null_order_ts
FROM orders;
That difference between count(*) and count(column) is the mechanism doing the work here, and it is documented alongside the other aggregates in the PostgreSQL aggregate function reference.
Watch for nulls that are not null: the strings "NULL", "N/A", "-", "unknown", and empty strings all read as present values and pass a null check while behaving as missing data in every other respect.
A daily series stored as one row per day with orders is not the same as one row per day. Days with no activity usually do not appear at all, and any rolling calculation will close over the hole without complaint.
# Reindex against a full calendar to expose gaps.
daily = (df.set_index("order_date")
           .resample("D")["order_id"].count())
missing = daily[daily.isna()] if daily.hasnans else daily[daily == 0]
print(f"{len(missing)} days with no rows between {daily.index.min()} and {daily.index.max()}")
Then establish which kind of gap it is. A genuine zero-activity day and a failed ingestion job look identical in the output and require opposite responses.
Compare the set of entities present this period against last period and against a reference table. A store, region, or product line that reported last month and is absent this month is usually a feed that stopped, not a business that closed.
-- Regions present last month, absent this month.
SELECT DISTINCT region
FROM orders
WHERE order_month = DATE '2026-07-01'
EXCEPT
SELECT DISTINCT region
FROM orders
WHERE order_month = DATE '2026-08-01';
EXCEPT is supported in PostgreSQL, SQLite, and SQL Server; MySQL 8 supports it from 8.0.31 onward, and older versions need a LEFT JOIN ... IS NULL pattern instead.
Every numeric column has a plausible range and every date column has a plausible window. Test the boundaries rather than eyeballing a summary.
SELECT
    sum(CASE WHEN order_total < 0 THEN 1 ELSE 0 END)              AS negative_totals,
    sum(CASE WHEN order_total = 0 THEN 1 ELSE 0 END)              AS zero_totals,
    sum(CASE WHEN order_ts > now() THEN 1 ELSE 0 END)             AS future_dated,
    sum(CASE WHEN order_ts < DATE '2015-01-01' THEN 1 ELSE 0 END) AS implausibly_old
FROM orders;
Negative totals may be legitimate refunds, in which case the finding is that refunds are mixed into a table you were treating as sales. Future-dated rows usually indicate a timezone conversion applied twice. Sentinel dates such as 1900-01-01 or 1970-01-01 are placeholders that will silently anchor any date arithmetic you run.
Enumerate the actual values in every status and category column, and compare them against the set your logic assumes. New values appear without warning when an upstream team ships a feature.
-- Values outside the known set. The IS NULL clause matters:
-- NOT IN never returns true for NULL, so nulls would be silently excluded.
SELECT order_status, count(*) AS n
FROM orders
WHERE order_status NOT IN ('completed', 'pending', 'cancelled', 'refunded')
   OR order_status IS NULL
GROUP BY order_status
ORDER BY n DESC;
Also check for values that differ only by case or whitespace. "Completed", "completed ", and "completed" are three groups to a GROUP BY and one status to a human.
Identifiers, emails, postcodes, and currency codes have expected shapes. A column of order IDs where most entries match one pattern and a handful do not is usually two systems feeding one table.
Encoding damage is worth a specific look. Characters rendered as sequences like é indicate a UTF-8 file read as a different encoding, and this survives every numeric check while corrupting every name, address, and category label. Where the data reached you through a spreadsheet, the transformations described in the guide to cleaning messy data in Excel cover the repairs that are practical at that stage.
Analytical warehouses frequently do not enforce foreign keys, so orphans accumulate quietly and disappear from your results the moment you write an inner join.
-- Orders whose customer does not exist in the customers table.
SELECT count(*) AS orphan_orders
FROM orders o
LEFT JOIN customers c ON c.customer_id = o.customer_id
WHERE c.customer_id IS NULL;
The consequence is specific and easy to miss: an inner join drops those rows, so your revenue total falls without any error appearing. Run this before joining, and compare row counts before and after every join you write. Why the database does not stop you is a question about how storage and constraints work in analytical systems, covered in the primer on what a DBMS is and how it works.
A table can hold its stated grain and still contain business duplicates: the same customer submitting the same order twice through a retried payment, or a batch load applied twice with fresh surrogate keys.
-- Same customer, same amount, within a short interval: likely a resubmission.
SELECT customer_id, order_total, count(*) AS n, min(order_ts) AS first_seen
FROM orders
GROUP BY customer_id, order_total, date_trunc('minute', order_ts)  -- PostgreSQL
HAVING count(*) > 1
ORDER BY n DESC;
Confirm with the business before deleting anything. Some of these are real (a customer genuinely buying two identical items in separate transactions), and the distinction is a domain question rather than a data question.
Fields that must agree with each other are a rich source of quiet corruption, because each field passes its own validity check.
SELECT
    sum(CASE WHEN ship_ts   < order_ts THEN 1 ELSE 0 END) AS shipped_before_ordered,
    sum(CASE WHEN cancel_ts < order_ts THEN 1 ELSE 0 END) AS cancelled_before_ordered,
    sum(CASE WHEN status = 'cancelled' AND ship_ts IS NOT NULL THEN 1 ELSE 0 END) AS cancelled_but_shipped
FROM orders;
The most valuable check in this family is the additive one: confirm that a header total equals the sum of its lines. A mismatch between orders.order_total and the sum of order_lines.line_total means one of the two is wrong, and you need to know which before reporting either.
Compare this period's shape to its own recent history rather than to yesterday. A single day is noisy, so a comparison against a trailing median across several weeks is more stable than a day-over-day change.
Watch the mean, the null rate, the row count, and the share of each category value. A category that jumps from a small share of rows to a large one overnight is a mapping change upstream far more often than a change in behaviour.
Two separate questions. Is the data recent enough to answer the question, and does it stop changing once it lands?
SELECT
    max(order_ts)  AS latest_business_event,
    max(loaded_at) AS latest_load,
    now() - max(loaded_at) AS load_lag
FROM orders;
Late-arriving rows are the subtler issue. If yesterday's total keeps rising for three days as delayed records land, then any comparison between a fresh period and a settled one is unfair, and a report rerun next week will disagree with the version you presented. Establish how long a period takes to settle and exclude periods that have not.
The final check is the one that catches everything the others missed. Take a closed period, compute the total in your dataset, and compare it against the number the source system reports.
An exact match is rare and not required. What matters is that the difference is small, stable, and explained: known timing differences, a documented exclusion, a currency conversion. An unexplained gap is a finding regardless of how clean every other check came back. Failing to reconcile before publishing is one of the recurring patterns behind why analytics projects fail, because credibility rarely survives finance arriving at a different number in public.
"The data is bad" is not a finding. Every failed check resolves into one of three responses, and choosing between them is the analyst's judgement call rather than the pipeline's.
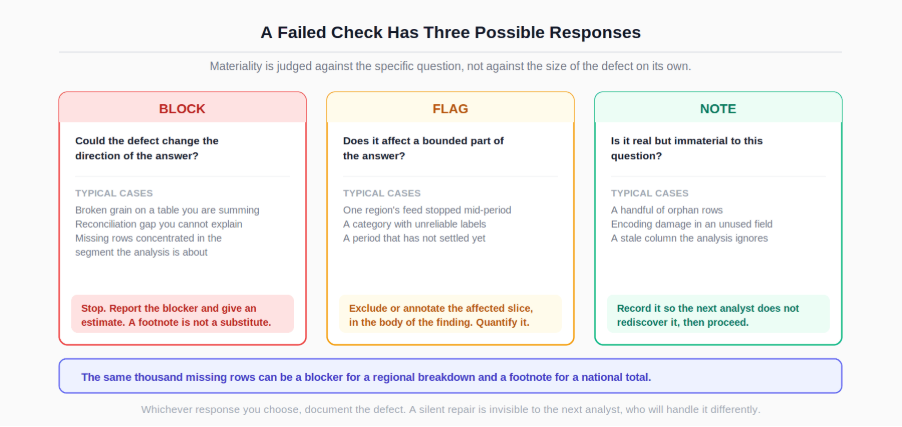
Block when the defect could change the direction of the answer. A broken grain, a failed reconciliation, or missing rows concentrated in the segment the analysis is about. The correct action is to stop, report the blocker, and give an estimate for resolution. Publishing with a footnote is not an acceptable substitute when the number itself could be wrong.
Flag when the defect affects part of the answer in a bounded way. Missing data in one region, a category with unreliable labels, a period that has not settled. Proceed with the affected slice excluded or annotated, state the exclusion in the body of the finding rather than in an appendix, and quantify what was dropped.
Note when the defect is real but immaterial to this question. A handful of orphan rows, encoding damage in a field the analysis does not use. Record it so the next person does not rediscover it, and move on.
The judgement is about materiality relative to the specific question, not about the size of the defect in isolation. The same thousand missing rows can be a blocker for a regional breakdown and a footnote for a national total.
Whatever the response, record what you found rather than fixing it silently. A quiet repair is invisible to the next analyst, who will hit the same problem and solve it differently, and the two of you will produce different numbers from the same table.
Fifteen checks run by hand once is a task. Run every week by hand, it is a task nobody completes. The move that makes validation durable is turning the checks into a single artefact that returns a status per check.
-- One result set, one row per check. Extend by adding UNION ALL blocks.
WITH checks AS (
    SELECT 'duplicate_order_ids' AS check_name,
           count(*) AS failures
    FROM (SELECT order_id FROM orders GROUP BY order_id HAVING count(*) > 1) d

    UNION ALL
    SELECT 'null_customer_id',
           count(*) - count(customer_id)
    FROM orders

    UNION ALL
    SELECT 'orphan_orders',
           count(*)
    FROM orders o
    LEFT JOIN customers c ON c.customer_id = o.customer_id
    WHERE c.customer_id IS NULL

    UNION ALL
    SELECT 'negative_order_total',
           sum(CASE WHEN order_total < 0 THEN 1 ELSE 0 END)
    FROM orders
)
SELECT check_name,
       failures,
       CASE WHEN failures = 0 THEN 'pass' ELSE 'investigate' END AS status
FROM checks
ORDER BY failures DESC;
Two extensions from there. Store the output with a timestamp so you can see when a check started failing, which is usually more informative than the failure itself. And where your team uses a transformation framework, move these into declared tests that run on every build rather than living in an analyst's saved query; the dbt documentation describes that model and test structure.
In Python the same idea is a list of assertions producing a report rather than raising on the first failure, so one run tells you everything that is wrong instead of the first thing. The pandas mechanics for the underlying operations are covered in the introduction to pandas for analysts, and the null handling specifics in the pandas guide to missing data.
For the SQL patterns these checks are built from, including grouping, anti-joins, and set operations, the essential SQL skills and query guide for data analysts covers the foundations.
For the repair work that follows a failed check when the data arrived as a spreadsheet, the techniques in cleaning messy data in Excel handle the practical fixes.
For automating the checks in a scripted workflow rather than running them by hand, the introduction to pandas for analysts is the natural next step.
And for the organisational context in which unvalidated analyses cause damage, the patterns in why analytics projects fail are worth reading alongside this.
Quiz
Question 1 of 15
FAQ
FREE COURSES
Most of an analyst's time goes into cleaning, not analyzing, and this course treats that seriously. Five compact modules cover the full workflow: inspecting and typing a new file, handling missing data and duplicates, standardizing text and catching invalid values, merging and reshaping multiple sources, and finally building one reusable, validated cleaning pipeline. Every lesson runs on a realistically messy dataset with genuine data quality problems built in on purpose, so what you're fixing is real, not simulated. Closes with two portfolio projects: a multi-source merge and a full reshape-and-validate pipeline.
A hands-on course that takes you from BI foundations to KPI design, SQL calculation, dashboards, data quality, experiments, and clear communication of insights. Every lesson uses worked examples, exercises, and interview questions. The description is two sentences. If you want it shorter, use: "Learn to design, calculate, analyze, and present KPIs, from BI foundations to dashboards, data quality, and experiments."
An 11-module SQL course for data analysts preparing for interviews, built around one consistent company (Kestrel Outfitters) and one repeated method: the Five Questions What is the grain? What rows do I need? How should I combine them? How should I calculate the answer? How do I validate it? Starts with how to approach an unfamiliar SQL problem, then builds through core retrieval, aggregation, joins, subqueries and CTEs, window functions, NULL and conditional logic, reshaping and combining data, working with time, and data quality and validation finishing with a dedicated module on performance for analysts. Every lesson includes a custom diagram and a set of interview questions tagged by difficulty (Screener, Analyst, Advanced, Case) and type (Conceptual, Query Writing, Debugging, Optimization, Business Case), each with a fully worked solution. PostgreSQL-first, with dialect callouts for MySQL, SQL Server, BigQuery, and Snowflake throughout.