How to Find the Root Cause of a Sales Drop Using Data
A decomposition-first approach to finding what actually caused a sales decline, with SQL to isolate the driver
5 Minutes Read
A decomposition-first approach to finding what actually caused a sales decline, with SQL to isolate the driver
“Sales are down 12% this quarter” is a headline, not a diagnosis. It could mean fewer transactions, smaller transactions, a shift toward lower-margin products, or a single large account that churned. Each of those has a different fix, and none of them is visible from the topline number alone.
Root cause analysis for a sales drop starts by decomposing revenue, not by guessing at explanations. This article walks through that decomposition using a running example: Northfield Retail, a mid-size retailer whose CFO has flagged a quarter-over-quarter revenue decline and wants to know why before the next board meeting.
Revenue is the product of volume and price, and both of those can be broken down further by channel, region, product line, or customer segment. Before forming a hypothesis about why sales dropped, the first job is figuring out exactly where the drop is concentrated.
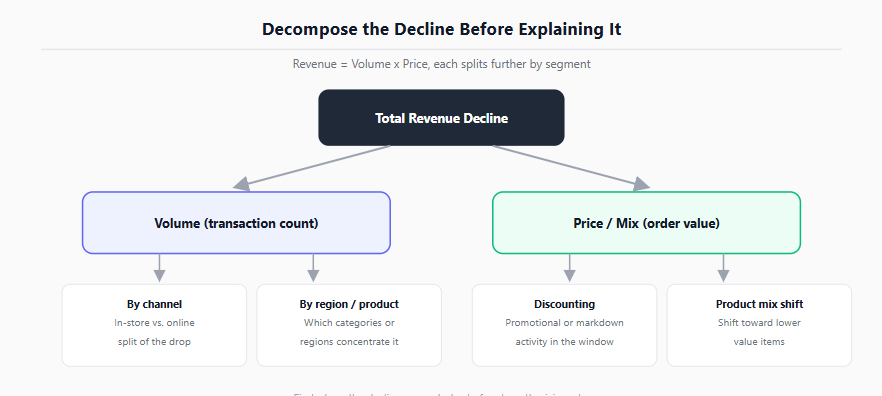
A decomposition diagram breaking total revenue decline into volume and price components, each split further by channel and product line
For Northfield, that means checking questions like these before anyone proposes a cause:
Is the decline driven by fewer transactions (volume) or lower revenue per transaction (price or mix)?
Is it concentrated in one channel (in-store versus online), one region, or one product category?
Is it broad-based across most customers, or concentrated in a small number of large accounts?
A drop that is uniform across every channel and product line points toward something structural (a macro demand shift, a broad pricing change). A drop concentrated in one segment points toward something specific to that segment, which is a much narrower, faster investigation.
Once the decomposition question is clear, SQL can answer “where” quickly. A standard approach is comparing the current period to a prior period, sliced by the dimension being tested (channel, region, product), and computing both volume and revenue for each.
-- Compare revenue and transaction volume by channel, current vs prior quarter (PostgreSQL syntax)
SELECT
    channel,
    quarter,
    COUNT(DISTINCT order_id) AS transaction_count,
    SUM(order_total) AS total_revenue,
    ROUND(SUM(order_total) / NULLIF(COUNT(DISTINCT order_id), 0), 2) AS avg_order_value
FROM orders
WHERE quarter IN ('2026-Q1', '2026-Q2')
GROUP BY channel, quarter
ORDER BY channel, quarter;
NULLIF() here prevents a divide-by-zero error if a channel had zero transactions in either period, which is a common edge case when a new channel launched partway through the comparison window. COUNT(DISTINCT ...) and SUM() follow standard aggregate behavior covered in the PostgreSQL aggregation functions documentation. Once this query runs, a period-over-period percentage change per channel, per product line, and per region isolates which slice is driving the aggregate decline rather than assuming it applies everywhere equally.
For a more direct period comparison in a single query, a window function avoids joining the same table to itself:
SELECT
    channel,
    quarter,
    total_revenue,
    LAG(total_revenue) OVER (PARTITION BY channel ORDER BY quarter) AS prior_quarter_revenue,
    ROUND(
        100.0 * (total_revenue - LAG(total_revenue) OVER (PARTITION BY channel ORDER BY quarter))
        / NULLIF(LAG(total_revenue) OVER (PARTITION BY channel ORDER BY quarter), 0),
        1
    ) AS pct_change
FROM channel_quarterly_revenue;
LAG() and the PARTITION BY pattern used here follow the standard window function structure documented in the PostgreSQL window functions documentation, applied to a period-comparison problem instead of a running total or ranking.
Once the decline is isolated to a segment, the next step is figuring out which broad category of cause it falls into. Most sales declines trace back to one of four categories: demand-side (fewer or smaller orders from existing intent), supply-side (inventory, fulfillment, or availability issues), pricing or mix (higher prices or a shift toward lower-value items), or an external one-time factor (seasonality, a competitor promotion, a holiday calendar shift).
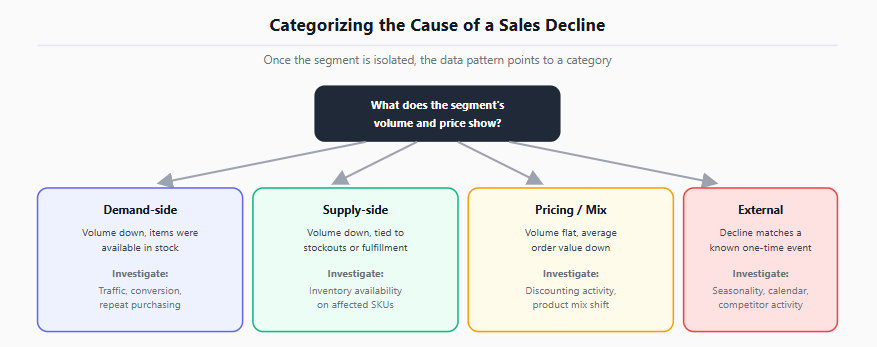
A decision flowchart routing a sales decline to demand, supply, pricing/mix, or external one-time causes based on what the segment-level data shows
For Northfield, if the decline is concentrated in the online channel with transaction volume down but average order value flat, that points away from pricing and toward either a demand-side issue (traffic or conversion) or a supply-side issue (stockouts on popular items). Checking whether flagship products showed reduced inventory availability during the decline window is a fast way to rule supply-side causes in or out before spending time on a demand-side investigation like traffic or conversion analysis.
If the decline instead shows flat transaction volume but falling average order value, that points toward pricing or mix, for example a shift toward promotional or lower-margin items, or a change in the product mix customers are buying. Distinguishing these two shapes (volume-driven versus value-driven) from the Step 2 query output is usually enough to rule out at least two of the four categories before any further investigation.
A plausible category is not the same as a confirmed cause. Before Northfield’s finding goes to the CFO, it needs a check against an obvious confound: did the prior-period comparison include an unusual event (a one-time bulk order, a promotional spike) that makes the “decline” partly an artifact of an inflated baseline rather than a genuine drop?
Comparing the affected segment against a longer trailing baseline, not just the immediately preceding quarter, helps rule this out. If the current quarter looks low only relative to an unusually strong prior quarter, but is in line with the trend from two or three quarters earlier, the framing of the finding changes substantially, from “sales are declining” to “sales returned to trend after a one-time high.” This is the same discipline covered more generally in the Gradient Learnings piece on why analytics projects fail: a conclusion that survives only one comparison point is not yet a validated finding.
Once the cause is confirmed, the recommendation should name the segment, the category of cause, and a specific next step, rather than restating the decline. “Online revenue is down 9%, driven by a volume drop concentrated in the outdoor gear category, coinciding with stockouts on the three highest-selling SKUs in that category. Recommendation: prioritize restocking those SKUs before evaluating a broader online demand investigation.” That framing mirrors the structure covered in the Gradient Learnings guide to presenting findings to senior leaders, which applies whether the finding is good news or, as with a sales drop, not.
Explaining the drop before decomposing it. A hypothesis formed before checking volume versus price, or before slicing by segment, risks fitting a story to a number that has a much narrower cause.
Comparing only to the immediately prior period. A single comparison point cannot distinguish a genuine decline from reversion after an unusually strong prior period.
Treating a uniform decline and a concentrated decline as the same investigation. They point toward structurally different categories of cause and different owners for the fix.
Skipping the divide-by-zero edge case in average order value or per-unit calculations when a new channel, region, or product line has incomplete data for one of the compared periods.
Assuming the first plausible category (demand, supply, pricing, external) is correct without checking the specific pattern in the data, such as whether volume or average order value is the component actually moving.
Presenting the segment and the category without a specific recommendation, which leaves the reader to infer what should happen next.
This article assumes basic comfort with SQL aggregation, joins, and window functions for the period-comparison queries above. If SQL is the gap, SQL for data analysts: essential skills is the right starting point. For a sales decline that traces back to a conversion problem rather than a volume or pricing issue, for example fewer completed purchases relative to site visits, funnel analysis: finding where customers drop off covers that specific investigation in more depth. If the next step is narrating a sales drop investigation in an interview setting, how to explain a data analyst project in an interview covers how to structure that story concisely.
Quiz
Question 1 of 15
FAQ